
Understanding Community Science
We had the honor of working with the Association of Science and Technology Centers (ASTC) on their Community Science Initiative. ASTC wanted to create a framework around the concept of community science to help and support their member museums to create their own community science initiatives going forward. Our role was to create visuals to represent different aspects of this framework. We used different visualization techniques for the various aspects.
These visualizations included
• A overarching diagram to show the big picture of their definition and framework for this Community Science Initiative.
• An illustration to show the various “approaches” within their framework to set the tone and humanize the content.
• Icons to represent the “attributes” and “outcomes” to categorize their examples of community science
• A logo for the initiative to be used through their materials for instant recognition
Read more about why we chose each of these visualization strategies for the specific content areas!
Overview diagram
This overview diagram represents the big picture of their framework and how ASTC defines community science. It shows the key components of the community science process and how they relate to one another. To best show this, we created a visual hierarchy, highlighted the critical elements, and then layered in secondary content. The arrow through the diagram cues the viewer to read it in left to right order.
The diagram shows how the main categories of ASTC’s analysis (approaches, attributes, outcomes) connect to the definition. This an approachable way for their members to learn about this framework, and use it as a handy reference. And we designed it so that it can be used in presentations or other materials going forward.
COmponents of the Diagram
Base content – showing the process of community science projects as they define them
Adding in the “Approaches” (on the blue lines)
“Attributes” and “Outcomes” icons – which add more detail about how they categorize the attributes and outcomes of community science projects

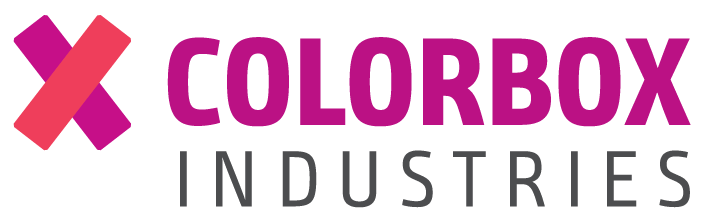
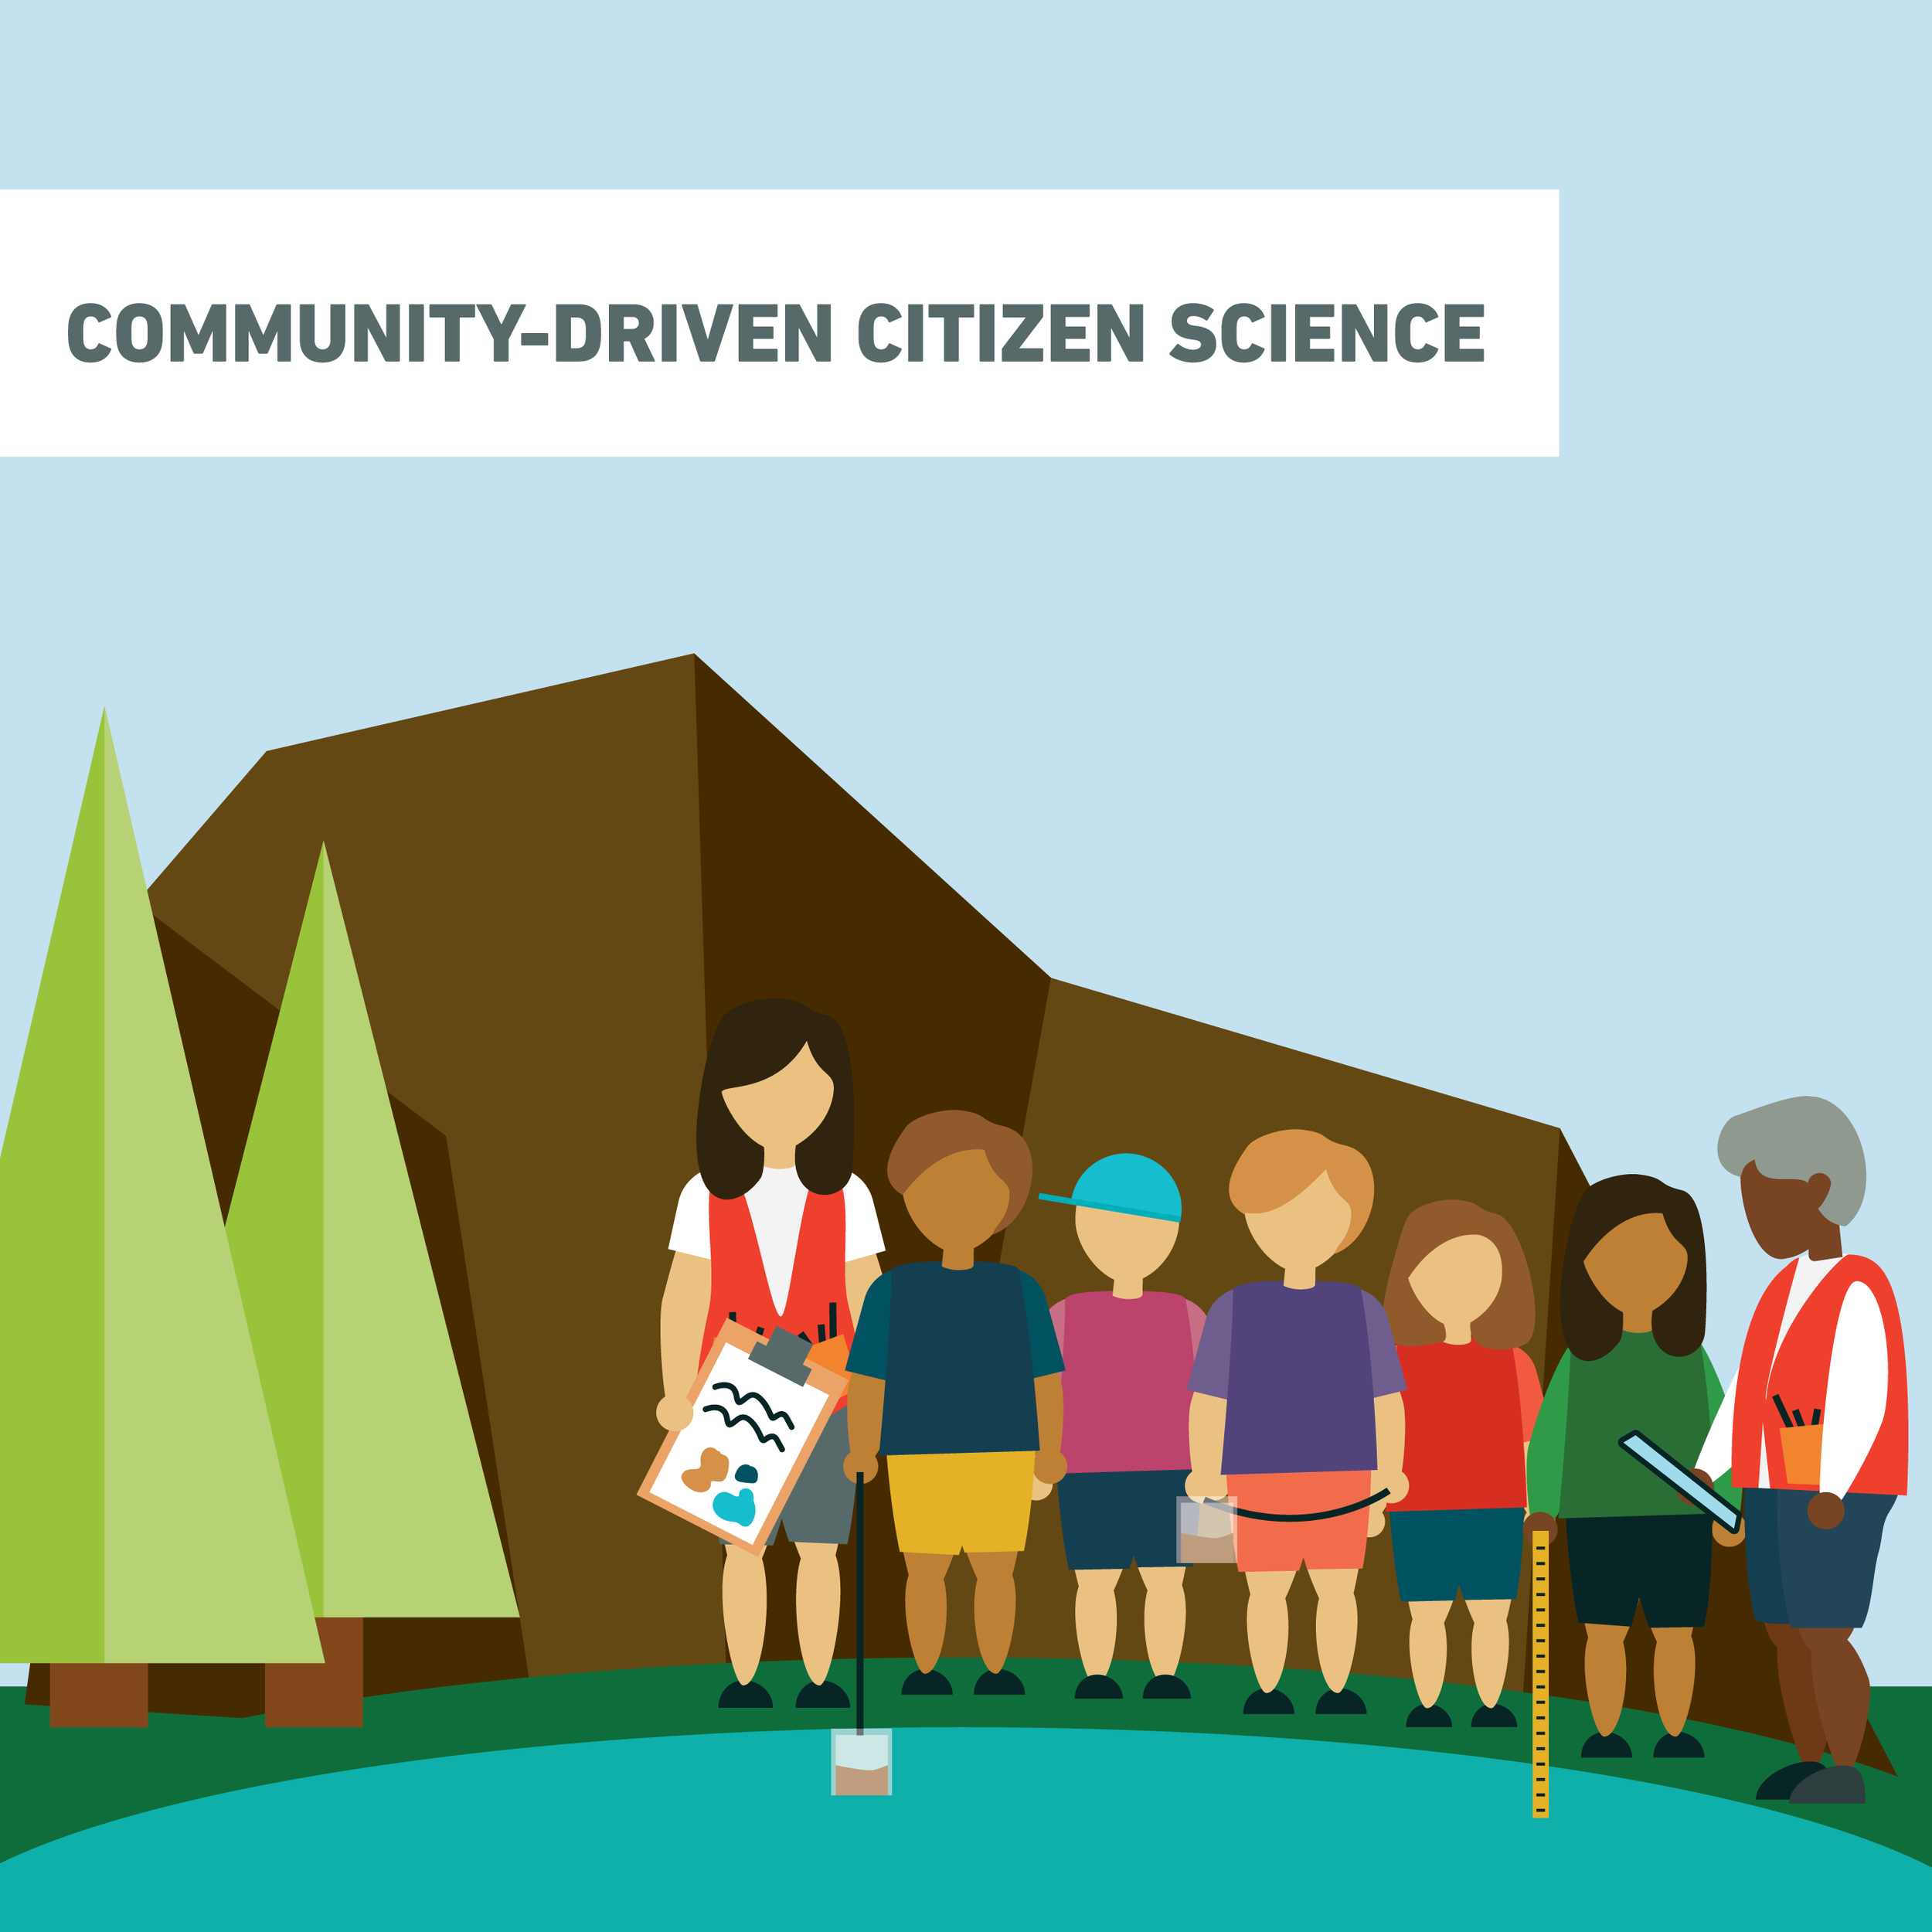
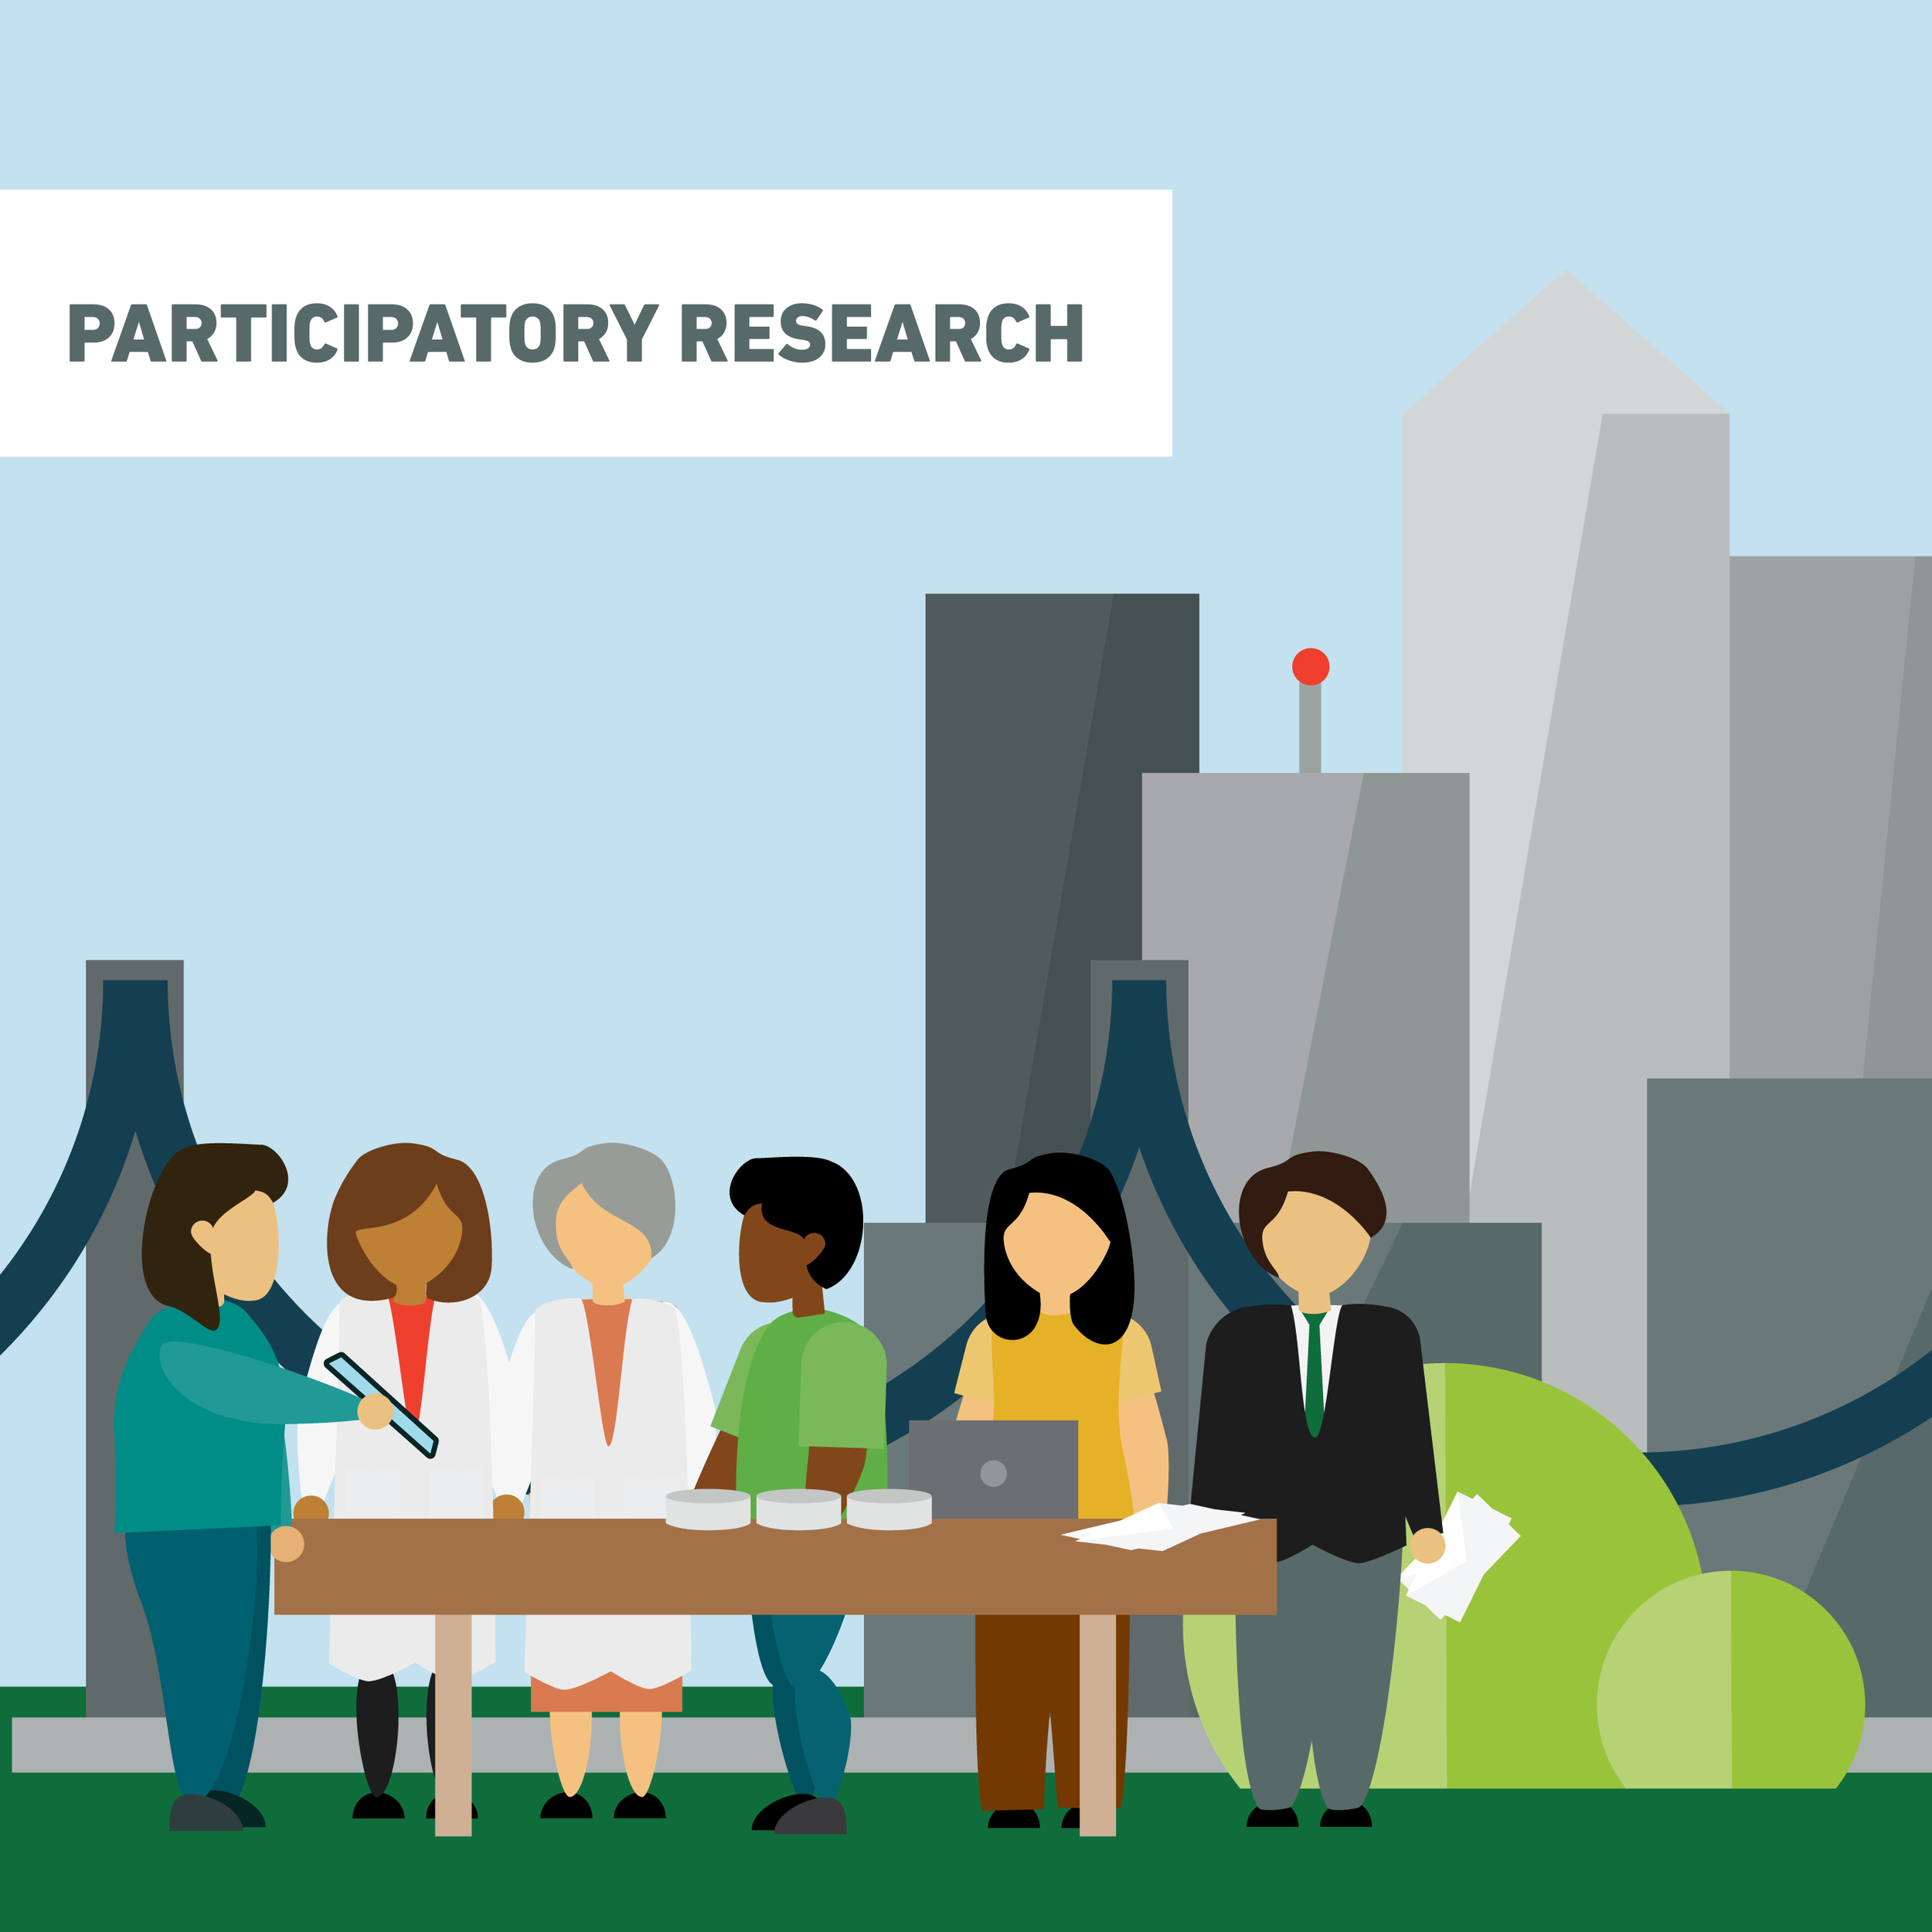
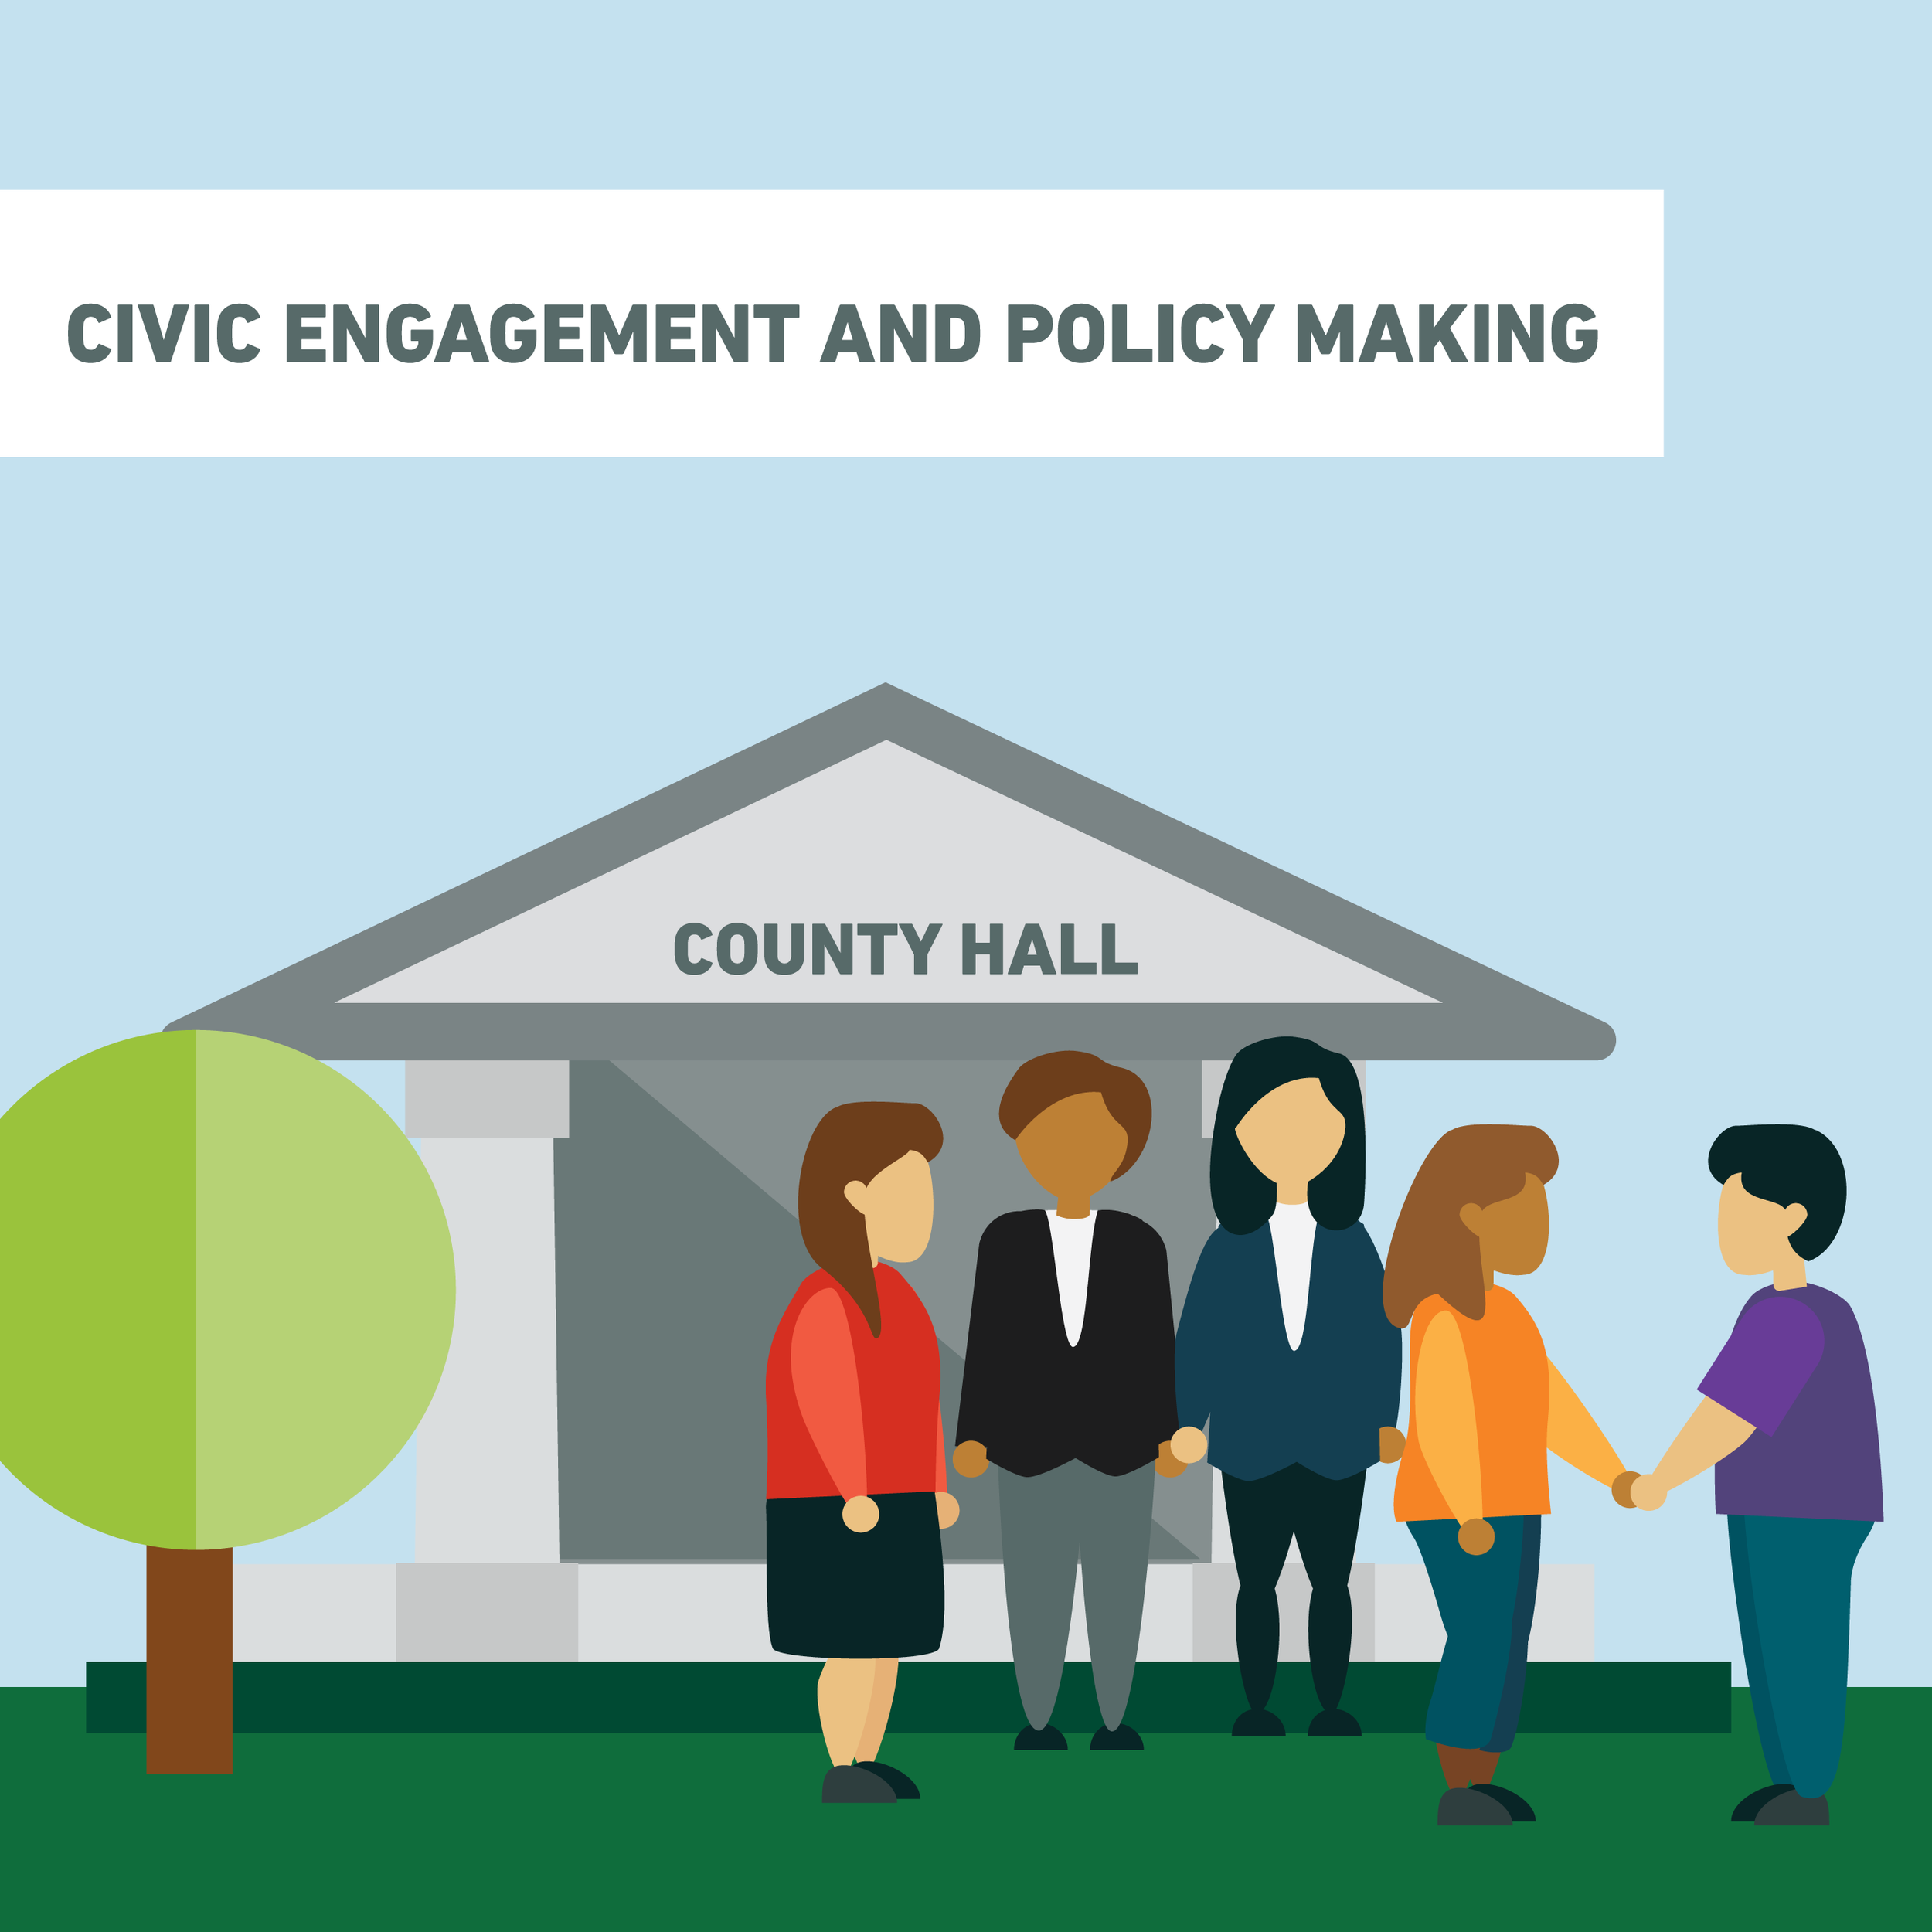
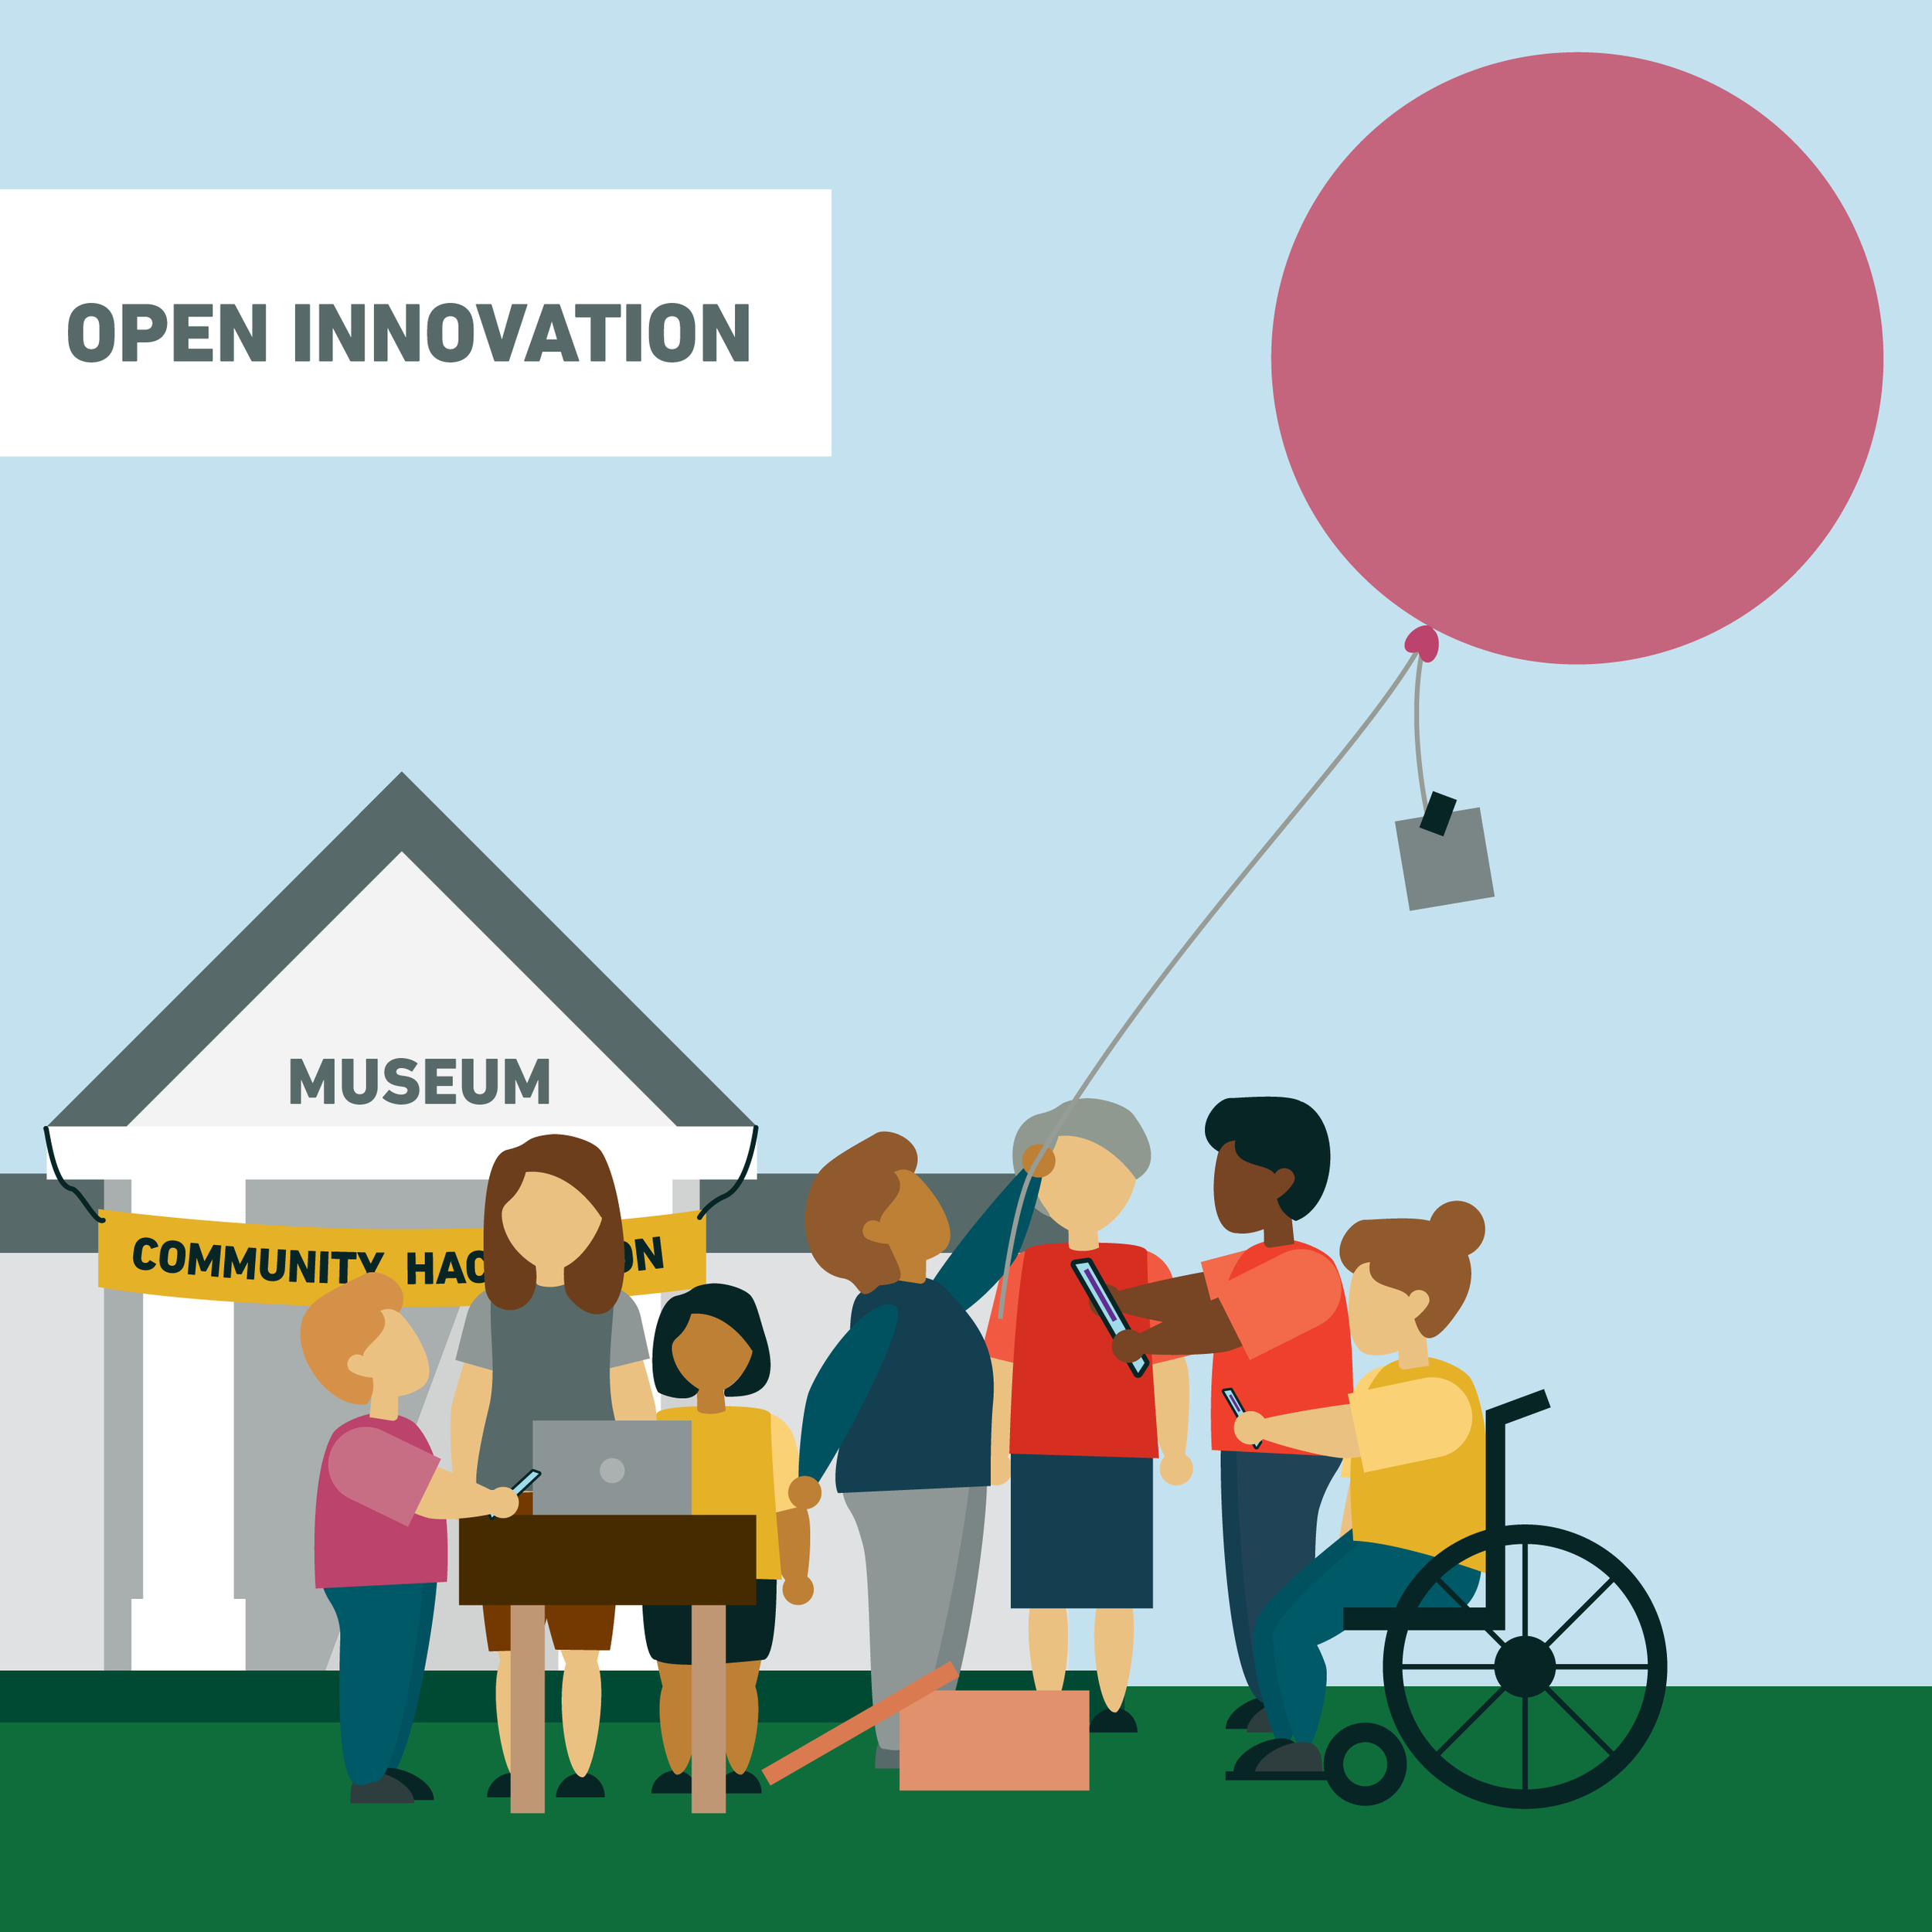
Tone setting illustration
Community science is all about community! By depicting groups of people engaging in science activities it shows the personal aspect of community science to go along with the framework. We learned about what each of these “Approaches” are and what their real-world applications look like so we could illustrate a general depiction of what may happen during each of these “Approaches.” We played with scale, simple shape illustrations, and a variety of different scenes to set the tone of how ASTC defines community science.
The full illustration was designed to be broken up into the individual “Approaches” for ease of use on their website, social media, and presentations.
LOgo and website integration
Beyond creating materials to best communicate ASTC’s Community Science Initiative, we designed everything to be used on the ASTC website. We worked with their web team to ensure the best integration possible for our assets and their content.
The logo we created is designed to depict that connection between community and science and is used in many applications including the favicon on their website. It helps to create a cohesive look through the many forms of visualizations we used throughout this project.

Screenshots of the ASTC’s Community Science Initiative website.


