

Commonwealth Fault Lines report
We designed a report and accompanying webpage about school segregation in Massachusetts for the organization Policy for Progress. The report was featured in a recent article in the Boston Globe.
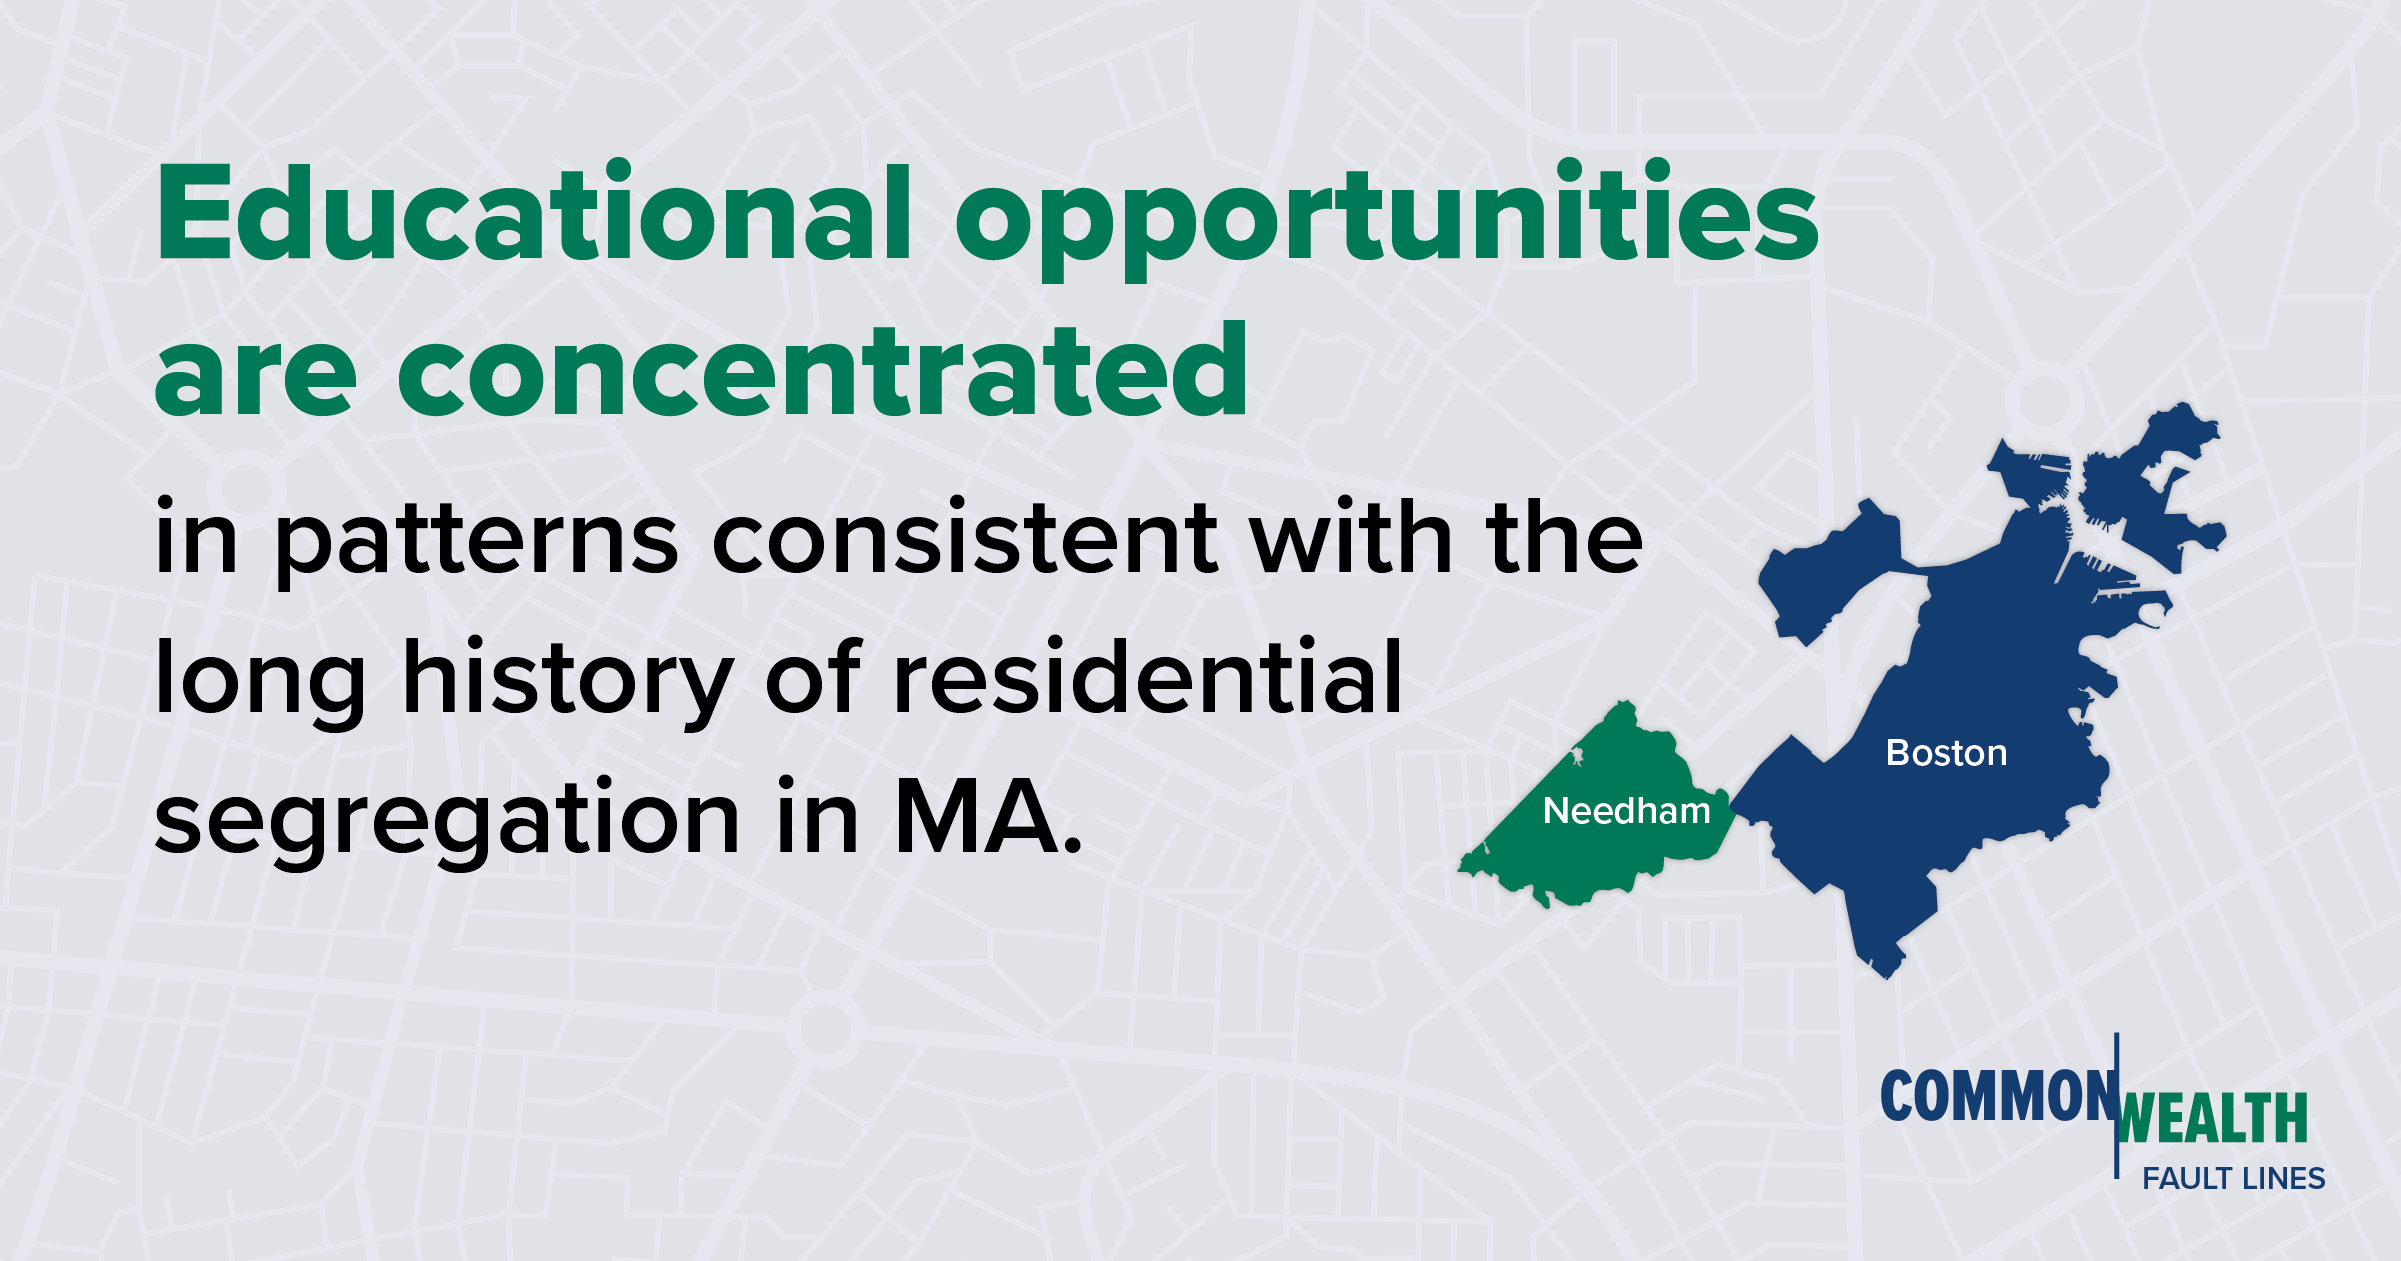
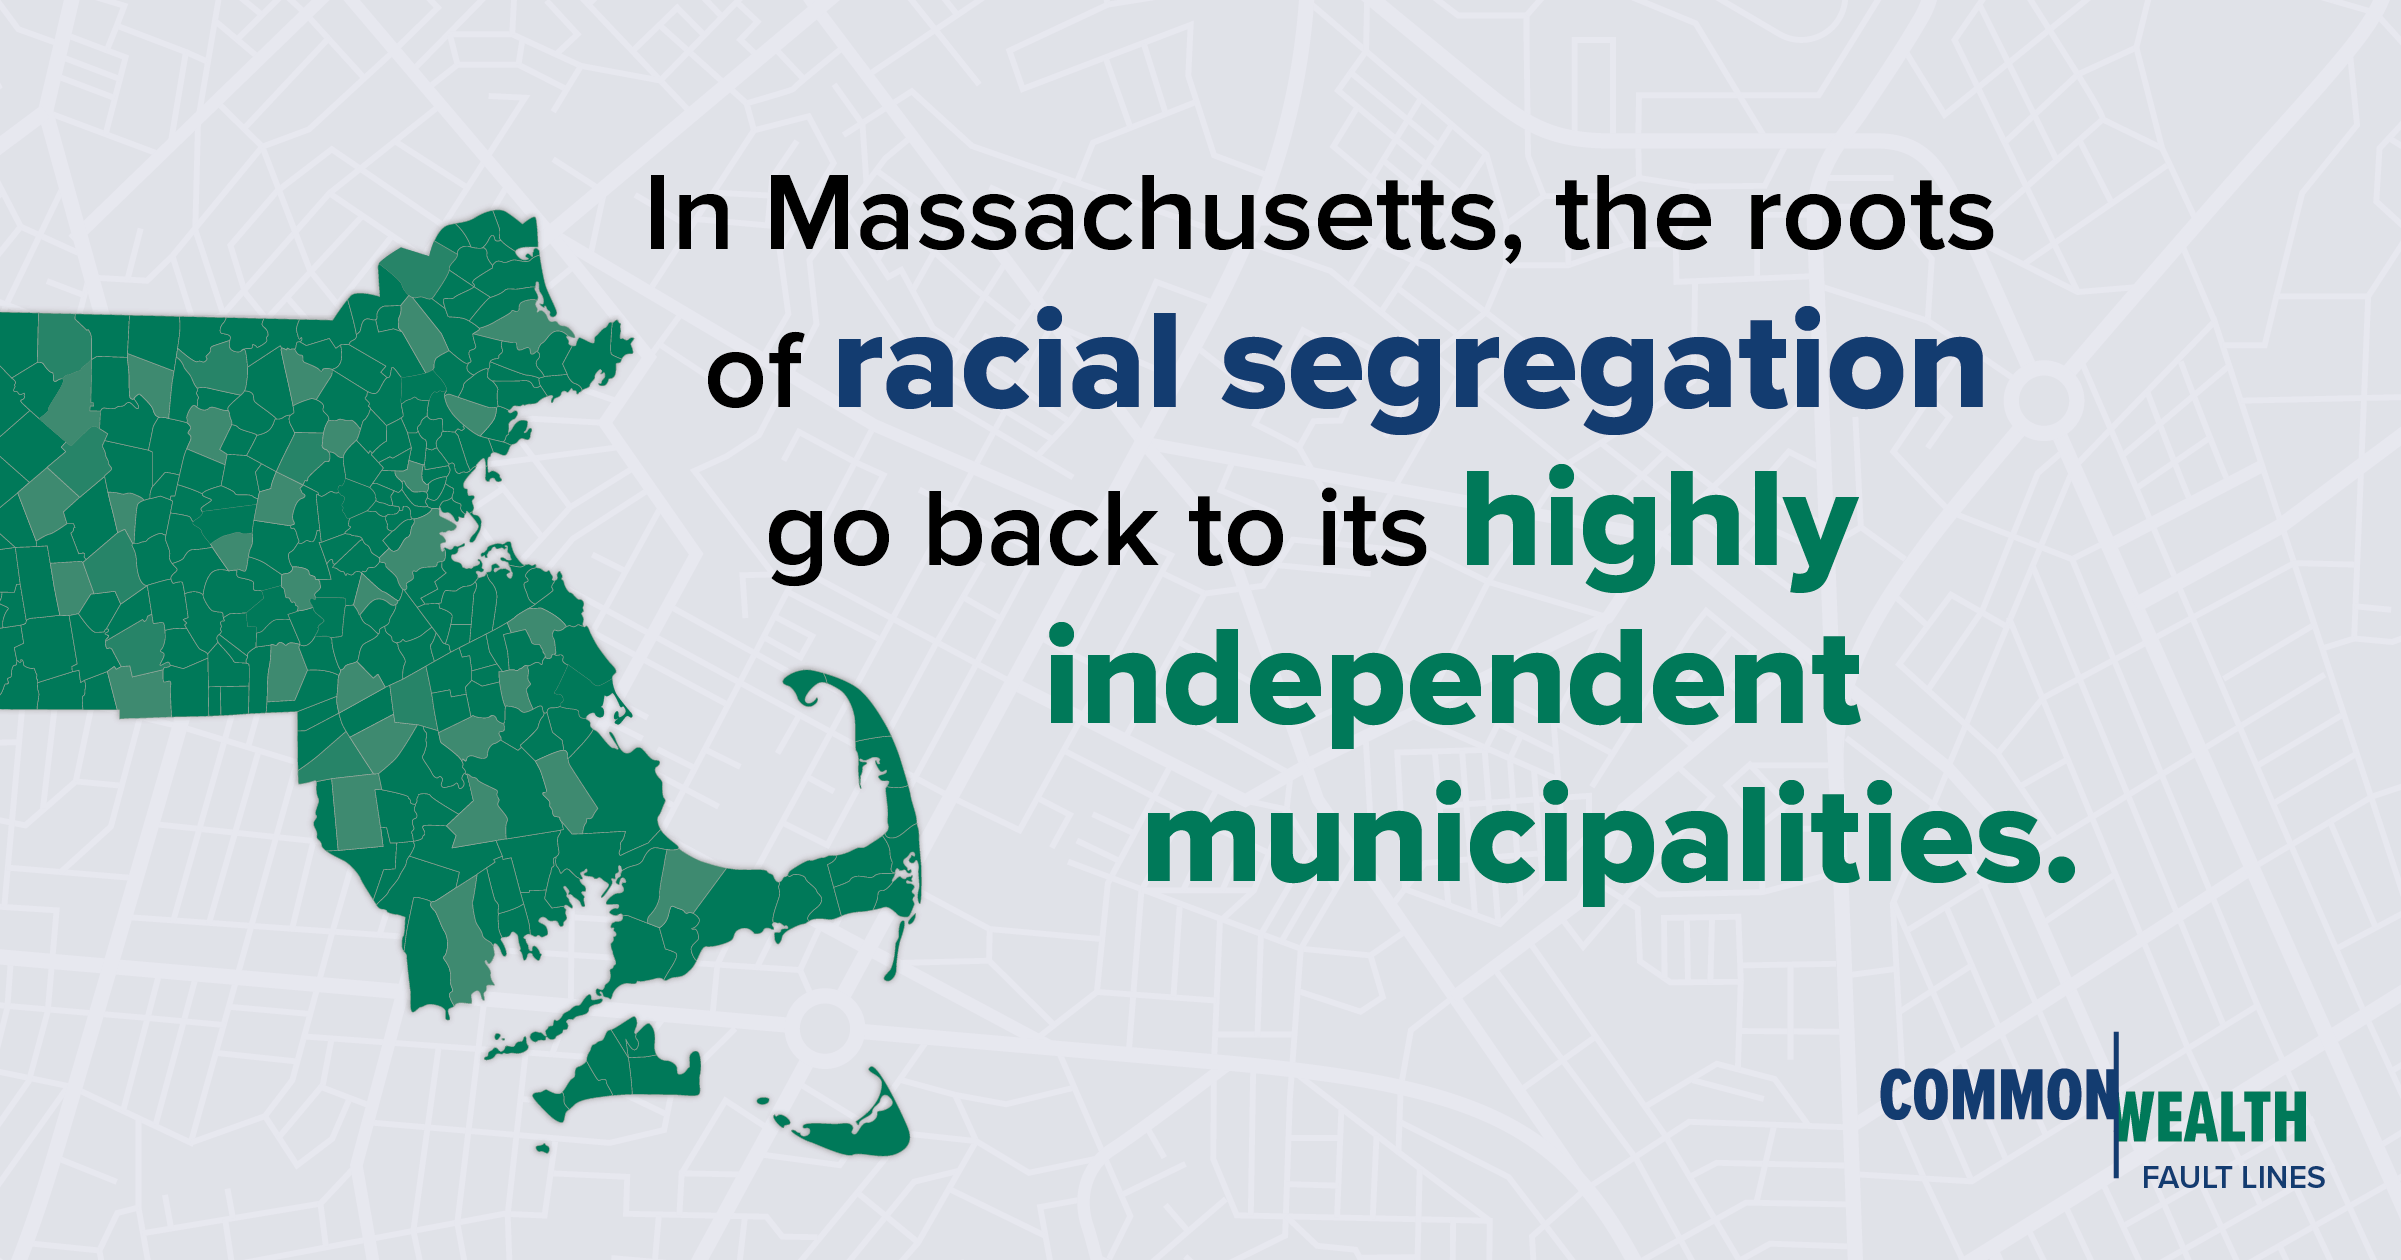
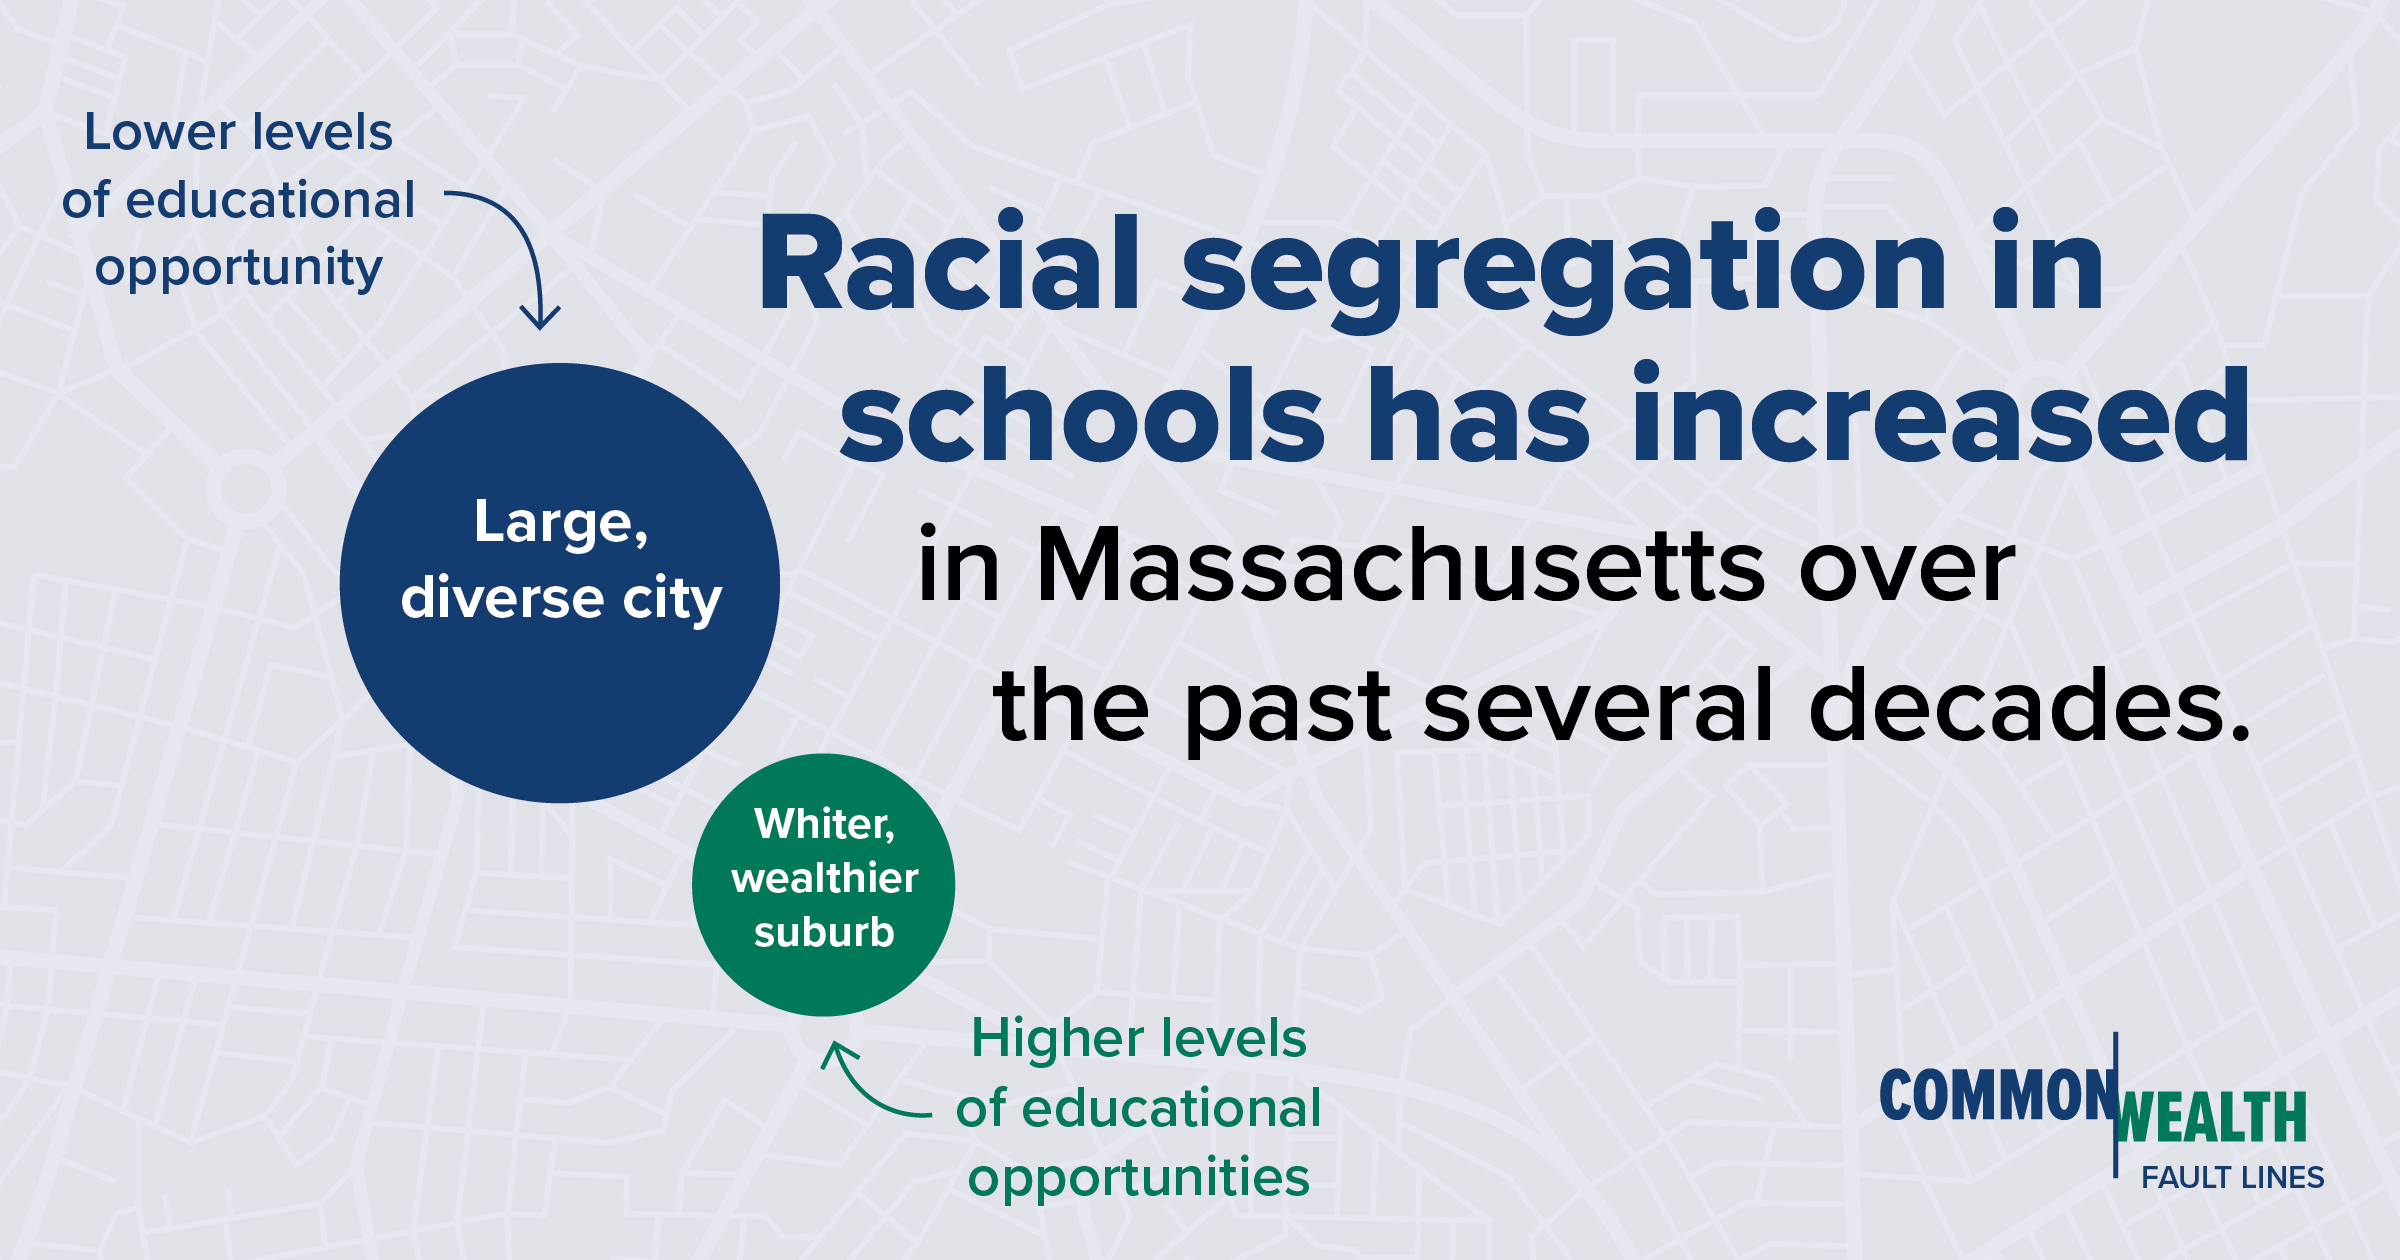
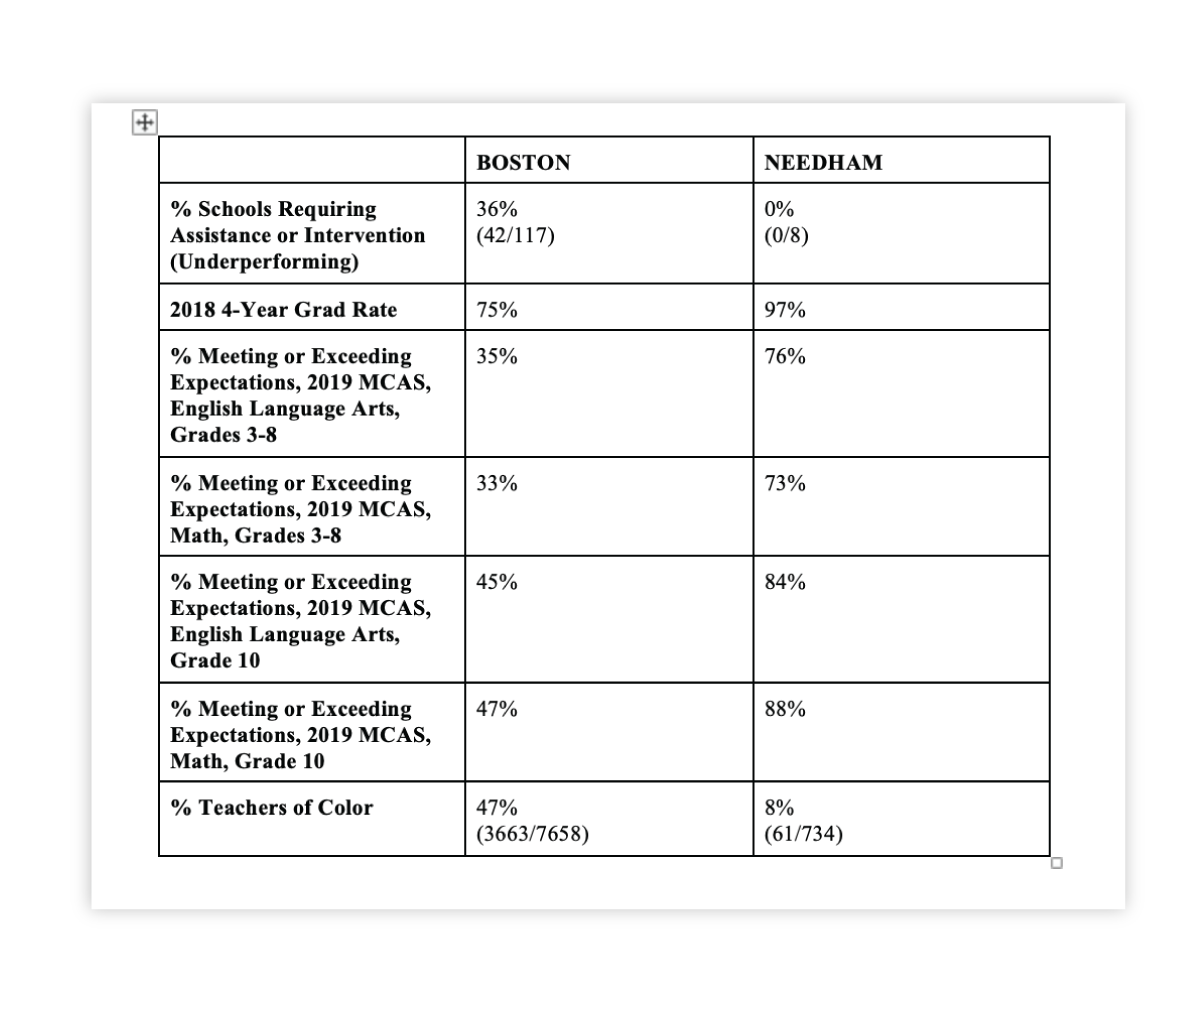
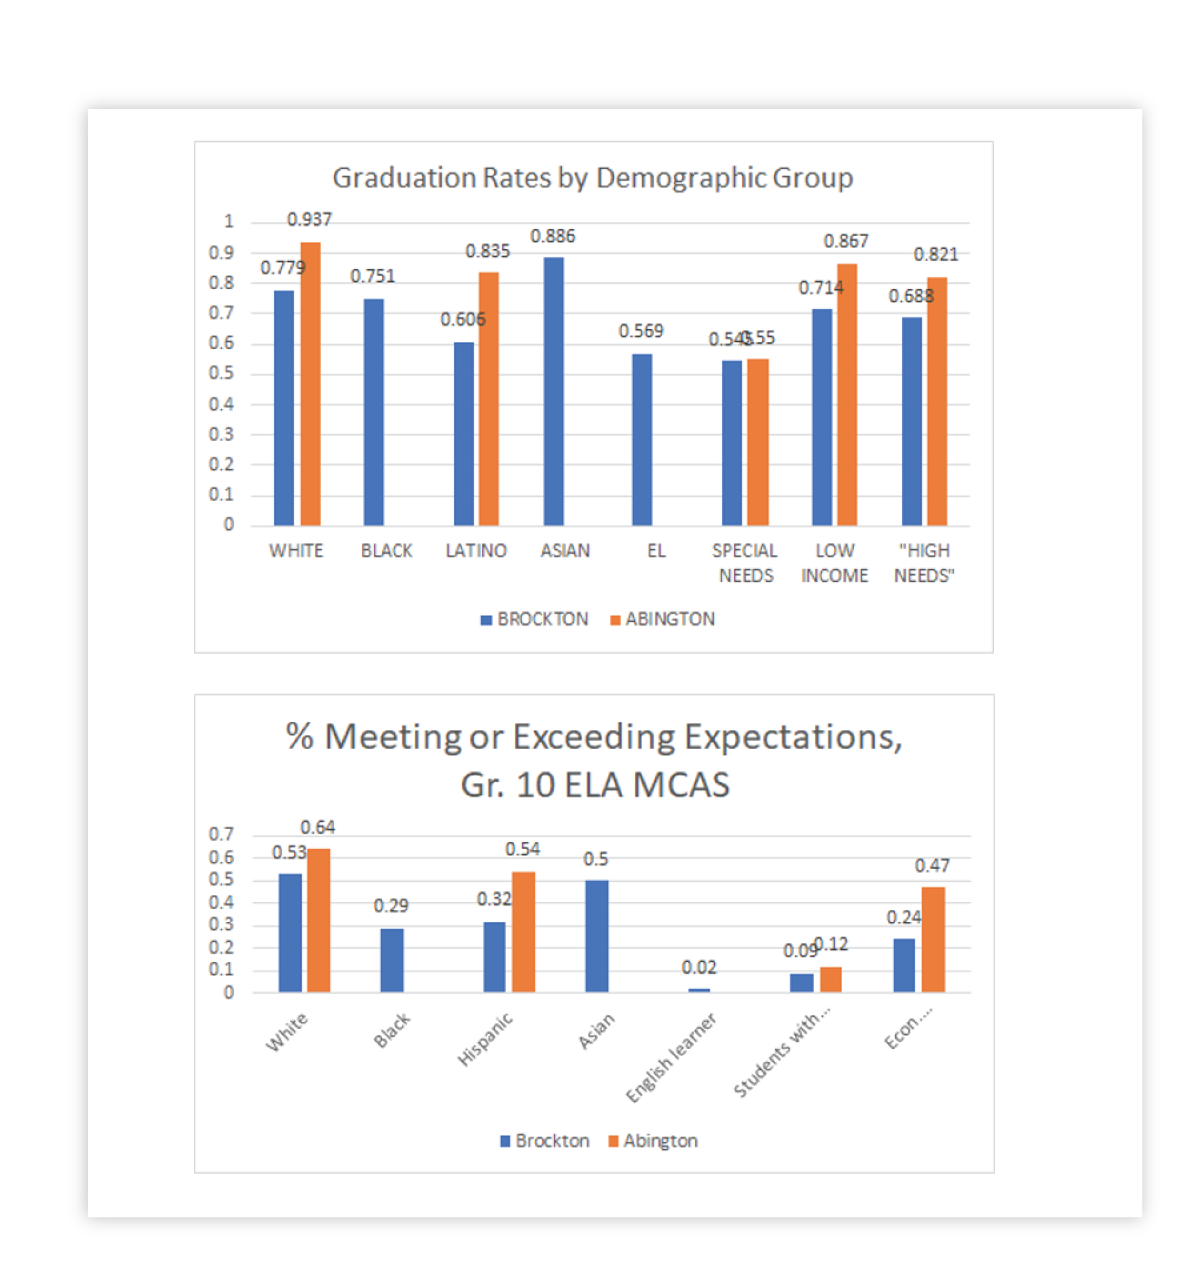
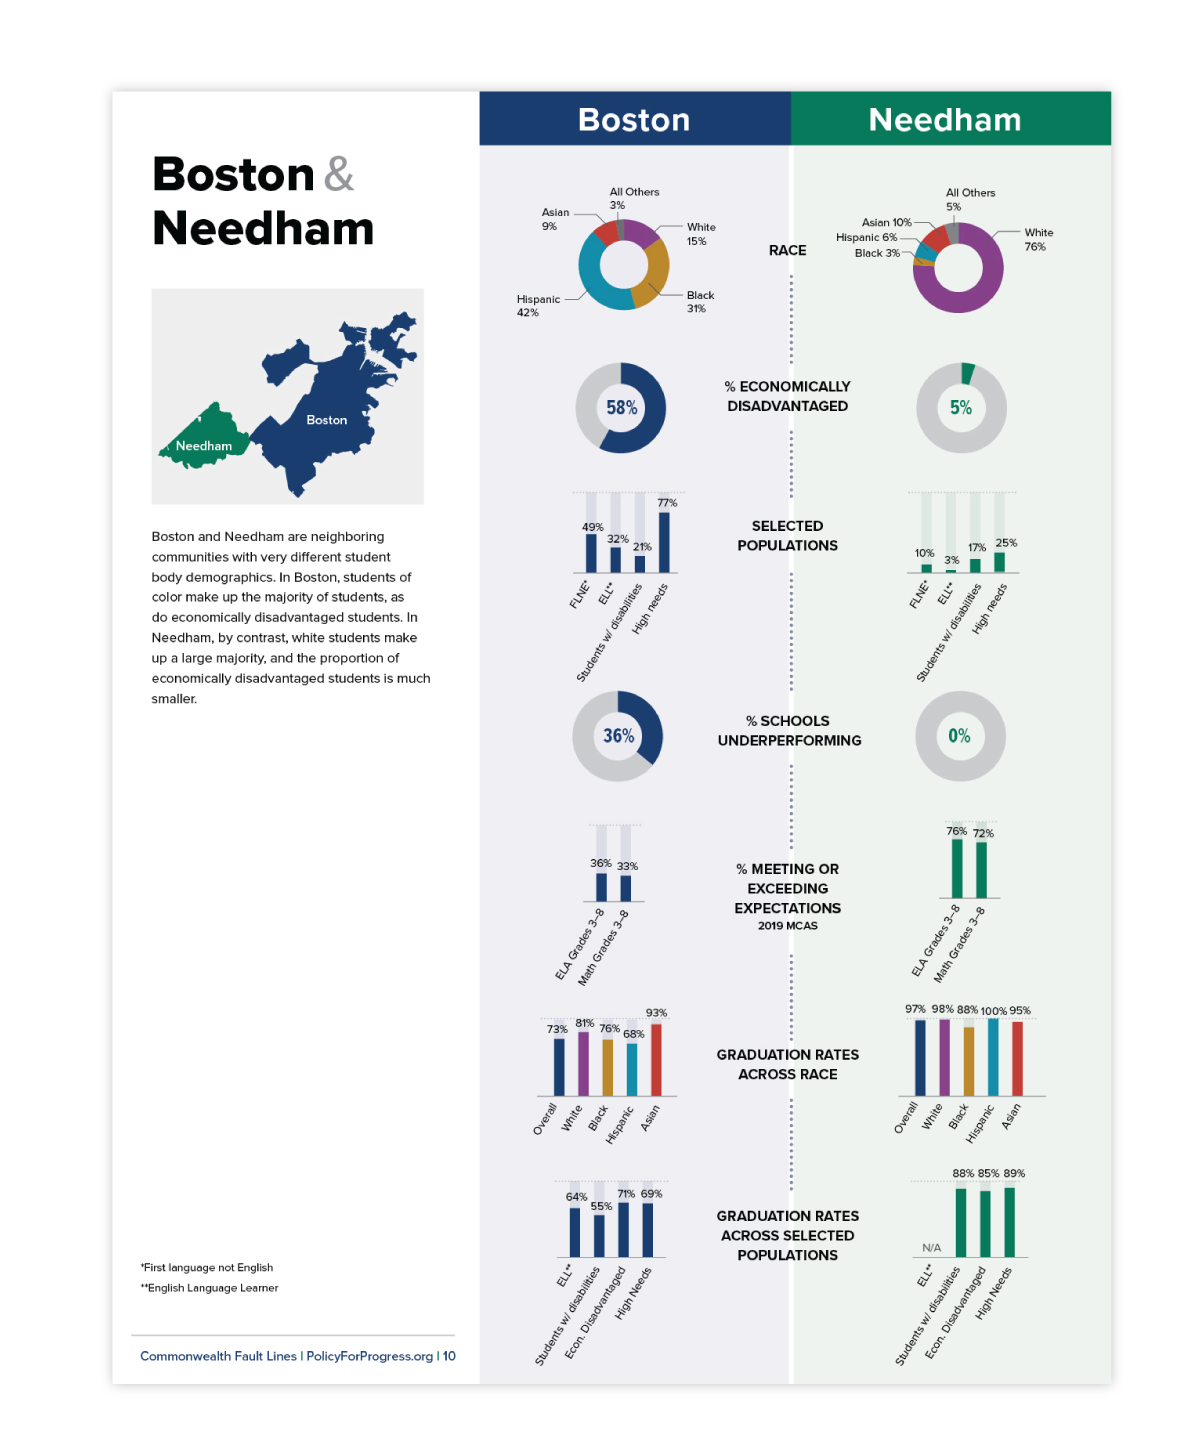
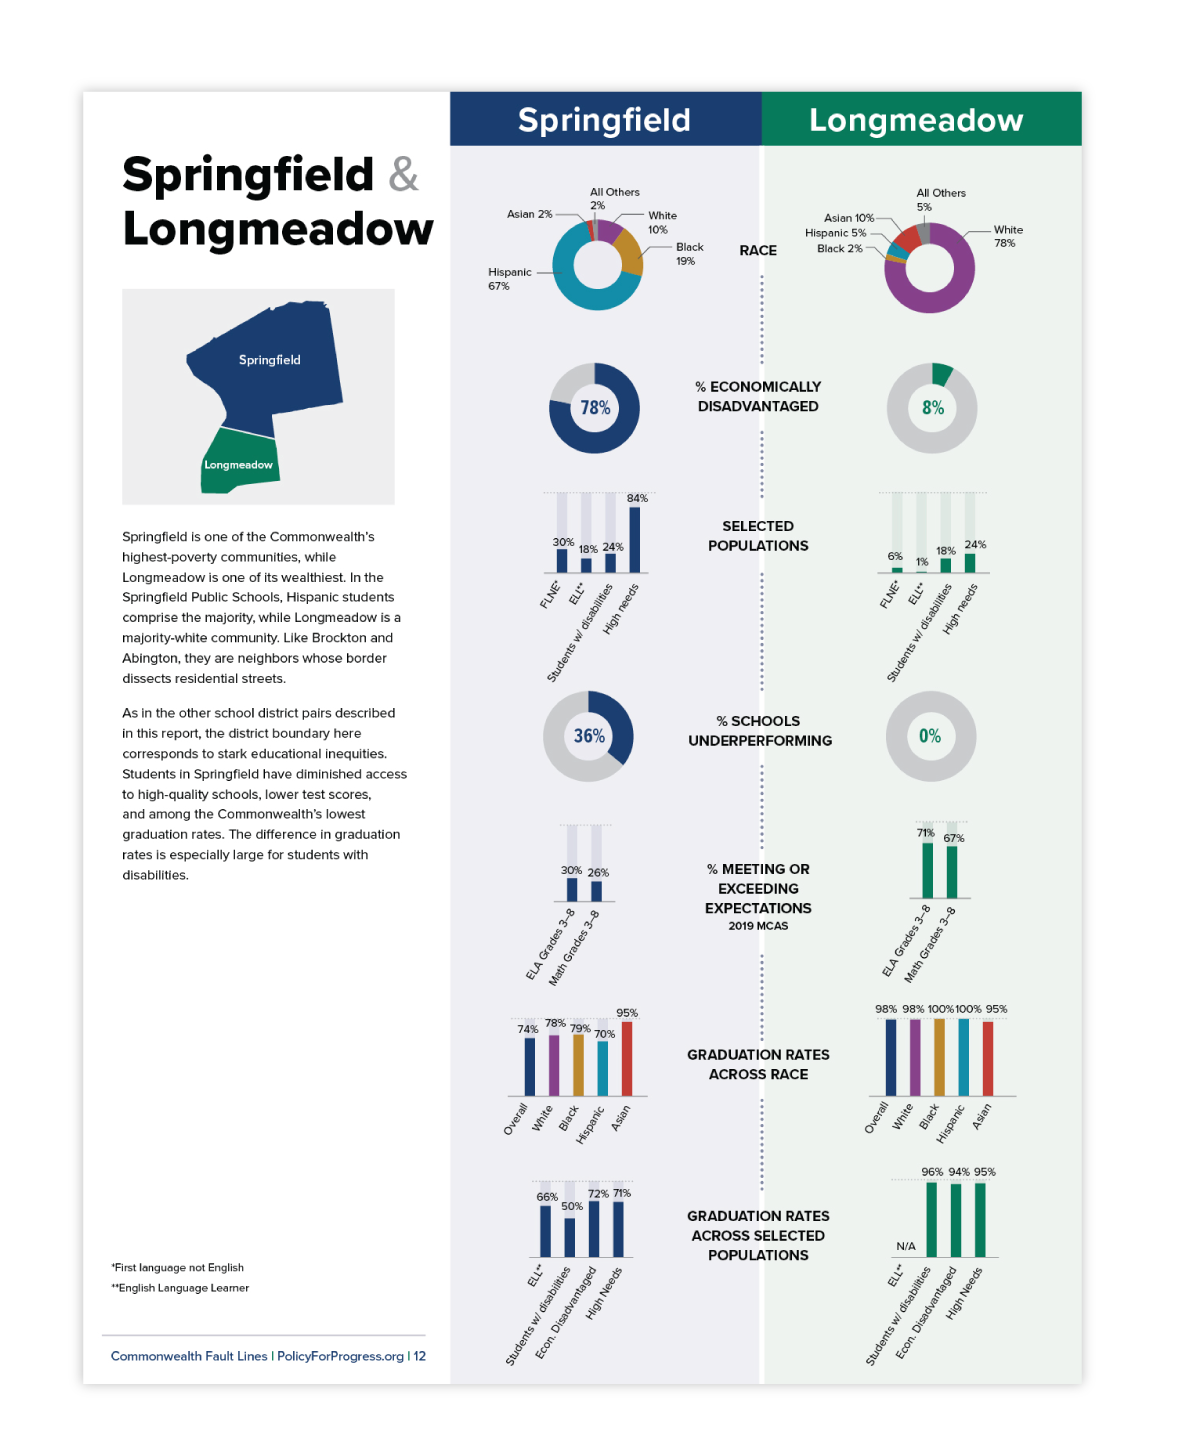
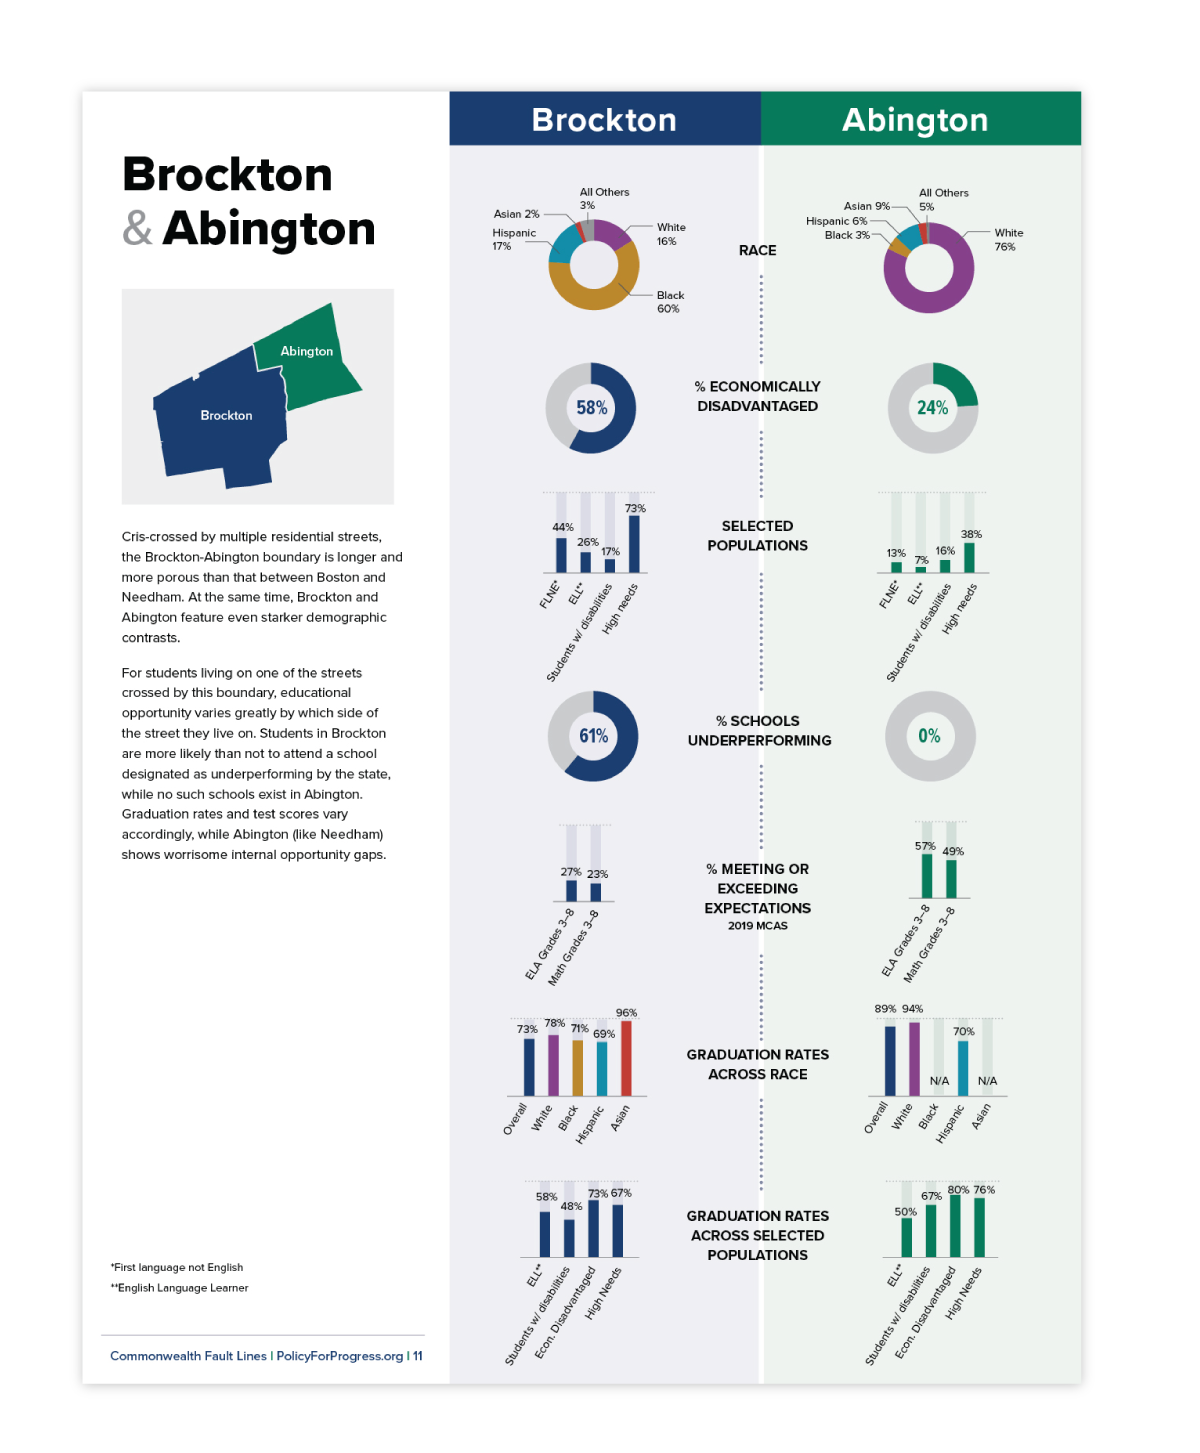
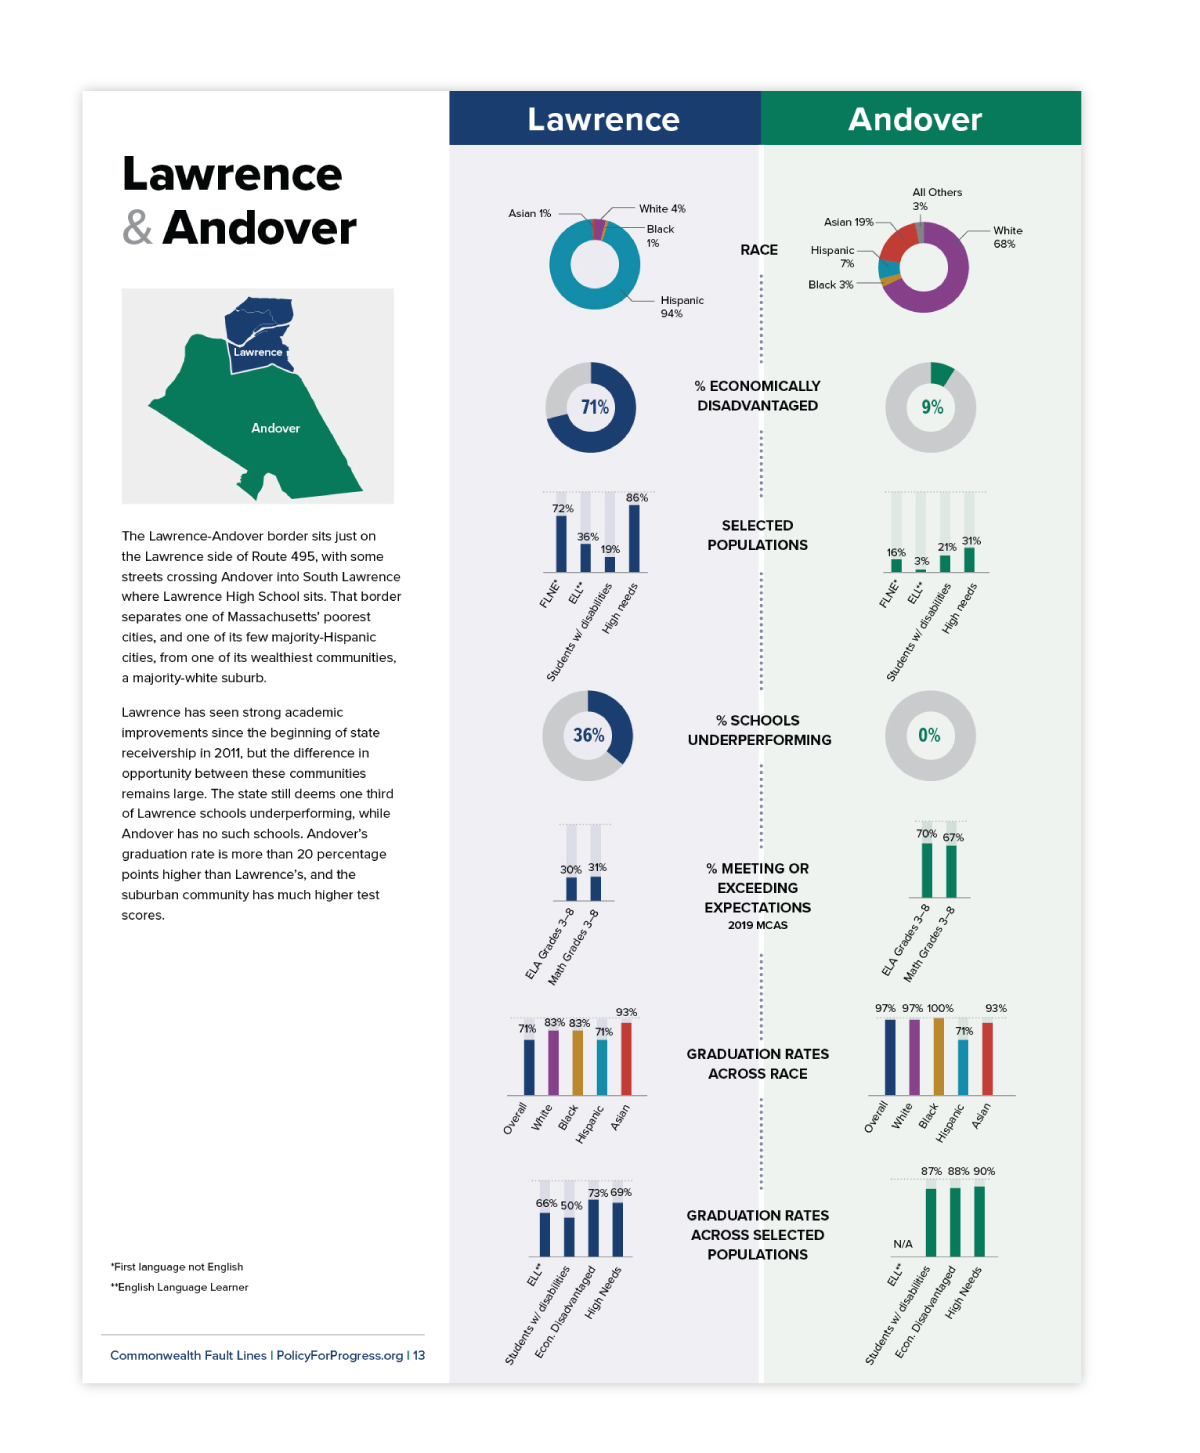
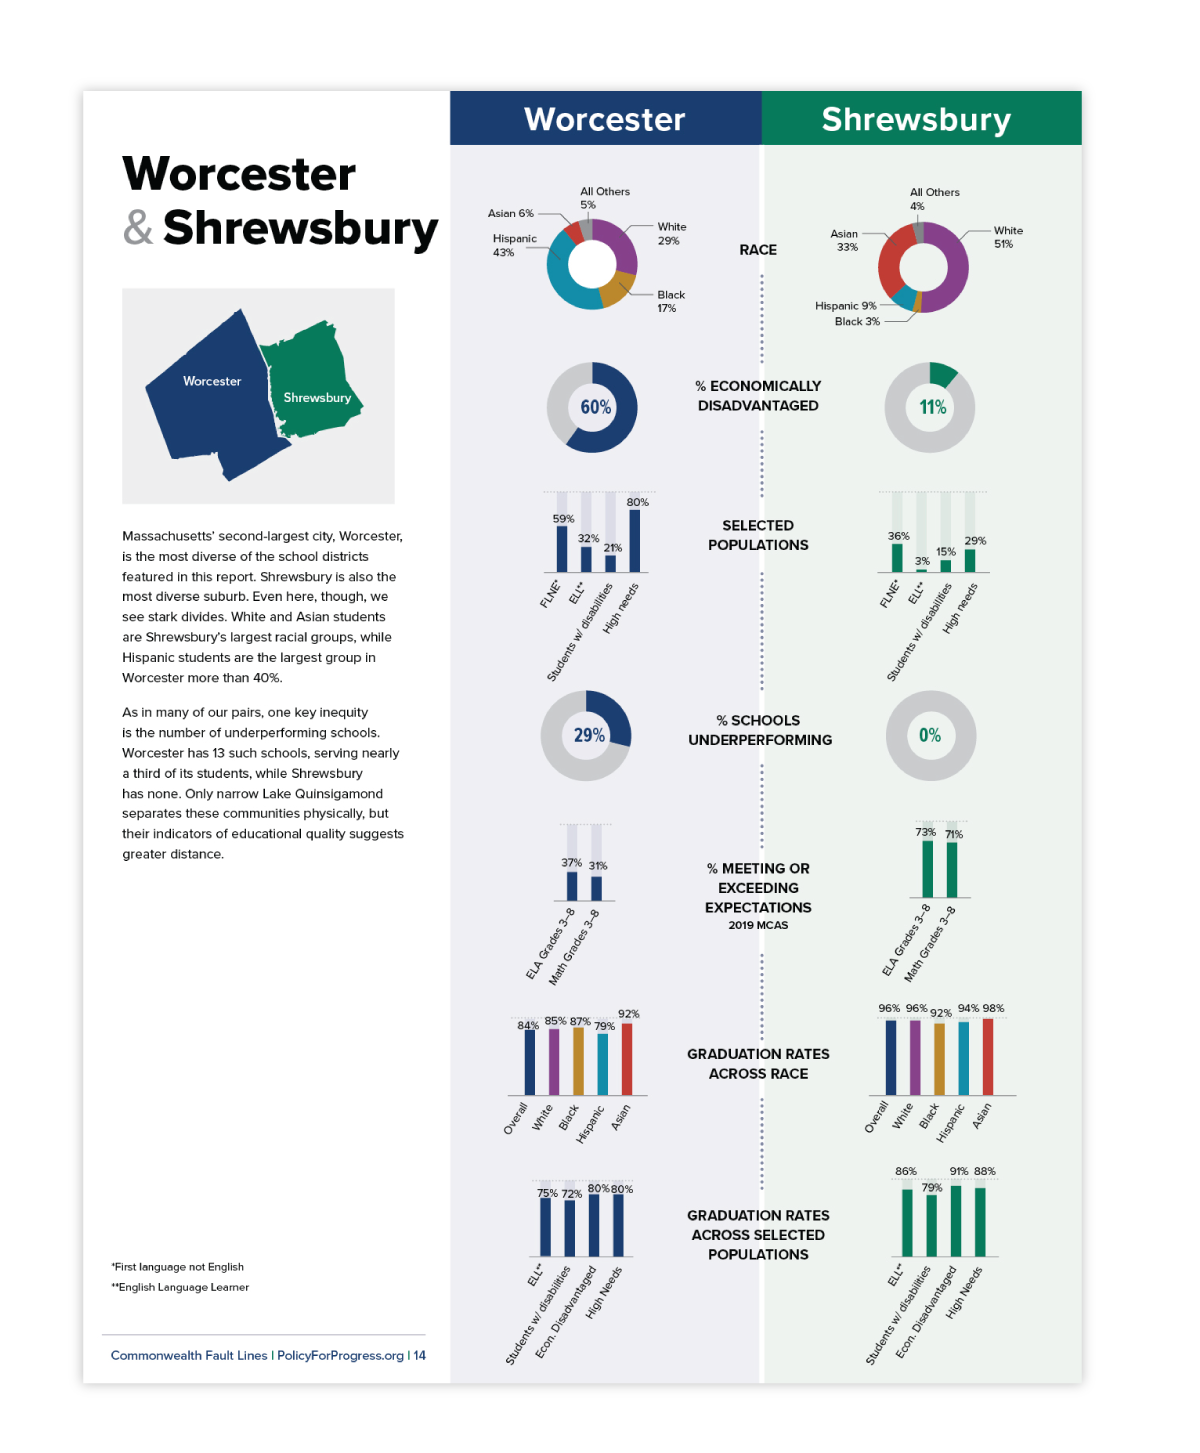
The report highlights school data from city/town pairs in Massachusetts that embody the problem of segregation. These include: Boston/Needham, Worcester/Shrewsbury, Lawrence/Andover, Brockton/Abington, and Springfield/Longmeadow.
what is the best way to showcase this data?
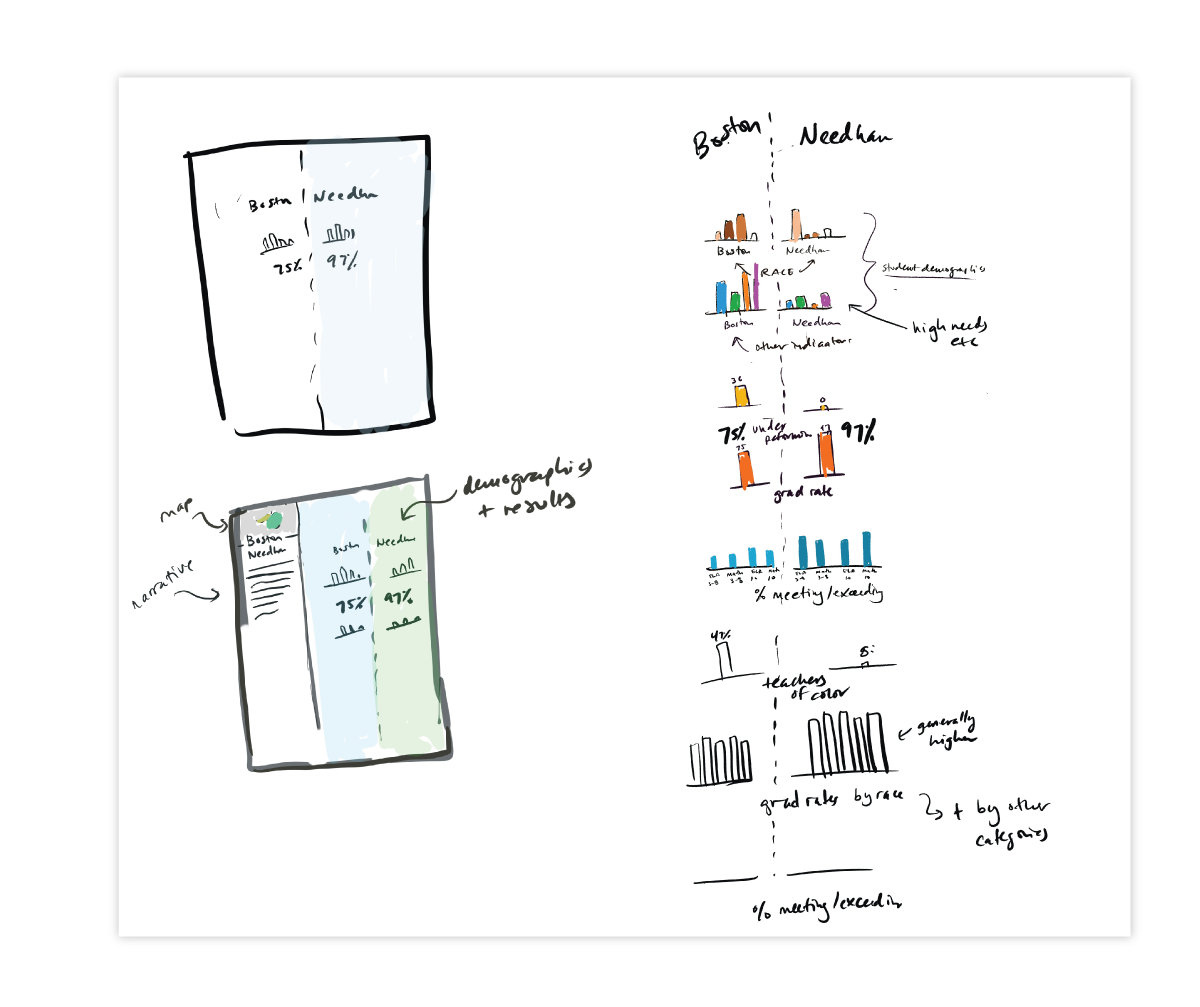
The team at Policy for Progress gave us school data clustered by the city/town pairs. We felt that the information would have more impact if the pages were visually split so that all the city data was on one side and the town data on the other.
In our design process, we think a lot about the hierarchy of information, and what a viewer can take away at a glance vs. in a deeper dive into the material. As we review the originally data we ask ourselves what is the data trying to tell us? What are the patterns? What are the key takeaways? Our goal is to make the main point immediately understandable at a glance and then layer in more details that can be understood in a deeper dive.

Our design solution
What this design accomplishes
Main takeaway is clear at a glance
Our new format makes it clear at a glance that you are comparing two places side by side, and the differences are immediately noticeable and shocking. It drives home the main message of the report which is that the schools on either side of these city/town divides are separate and unequal.
Color-coding makes interpretation easier from page to page
We color-coded the sides so that the city is always blue, and the wealthier town always green, so once you view one page, you are mentally prepped to read the next one.
Reduced clutter
We only needed to label the graph categories once, down the middle dividing line, instead of labeling both sides, which reduces general clutter on the page.


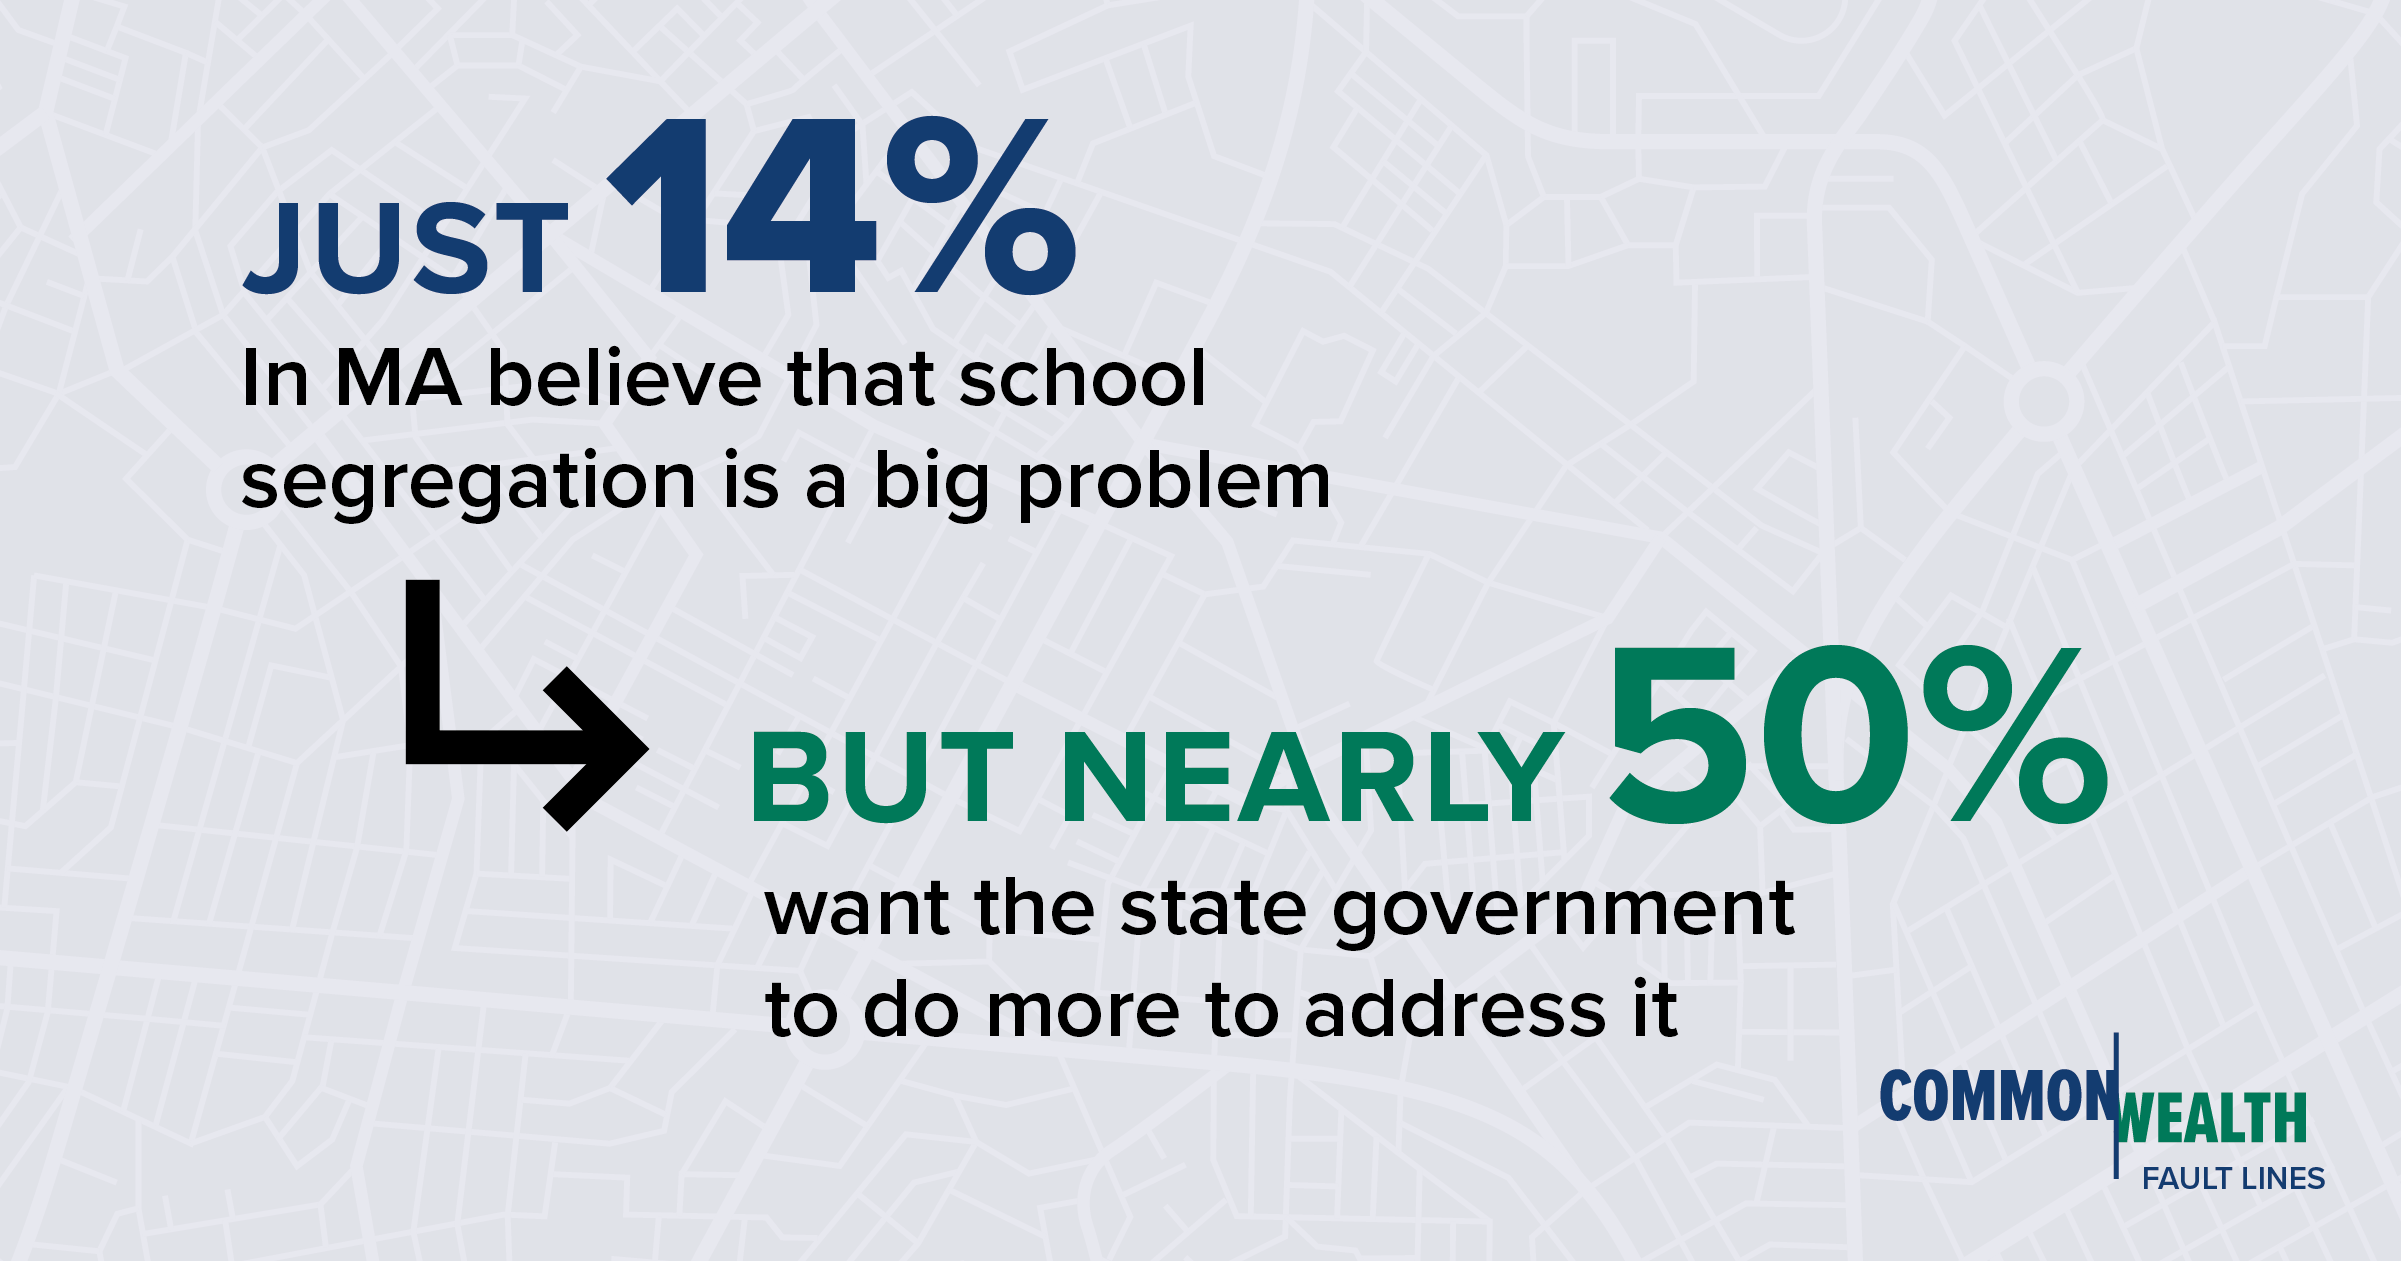
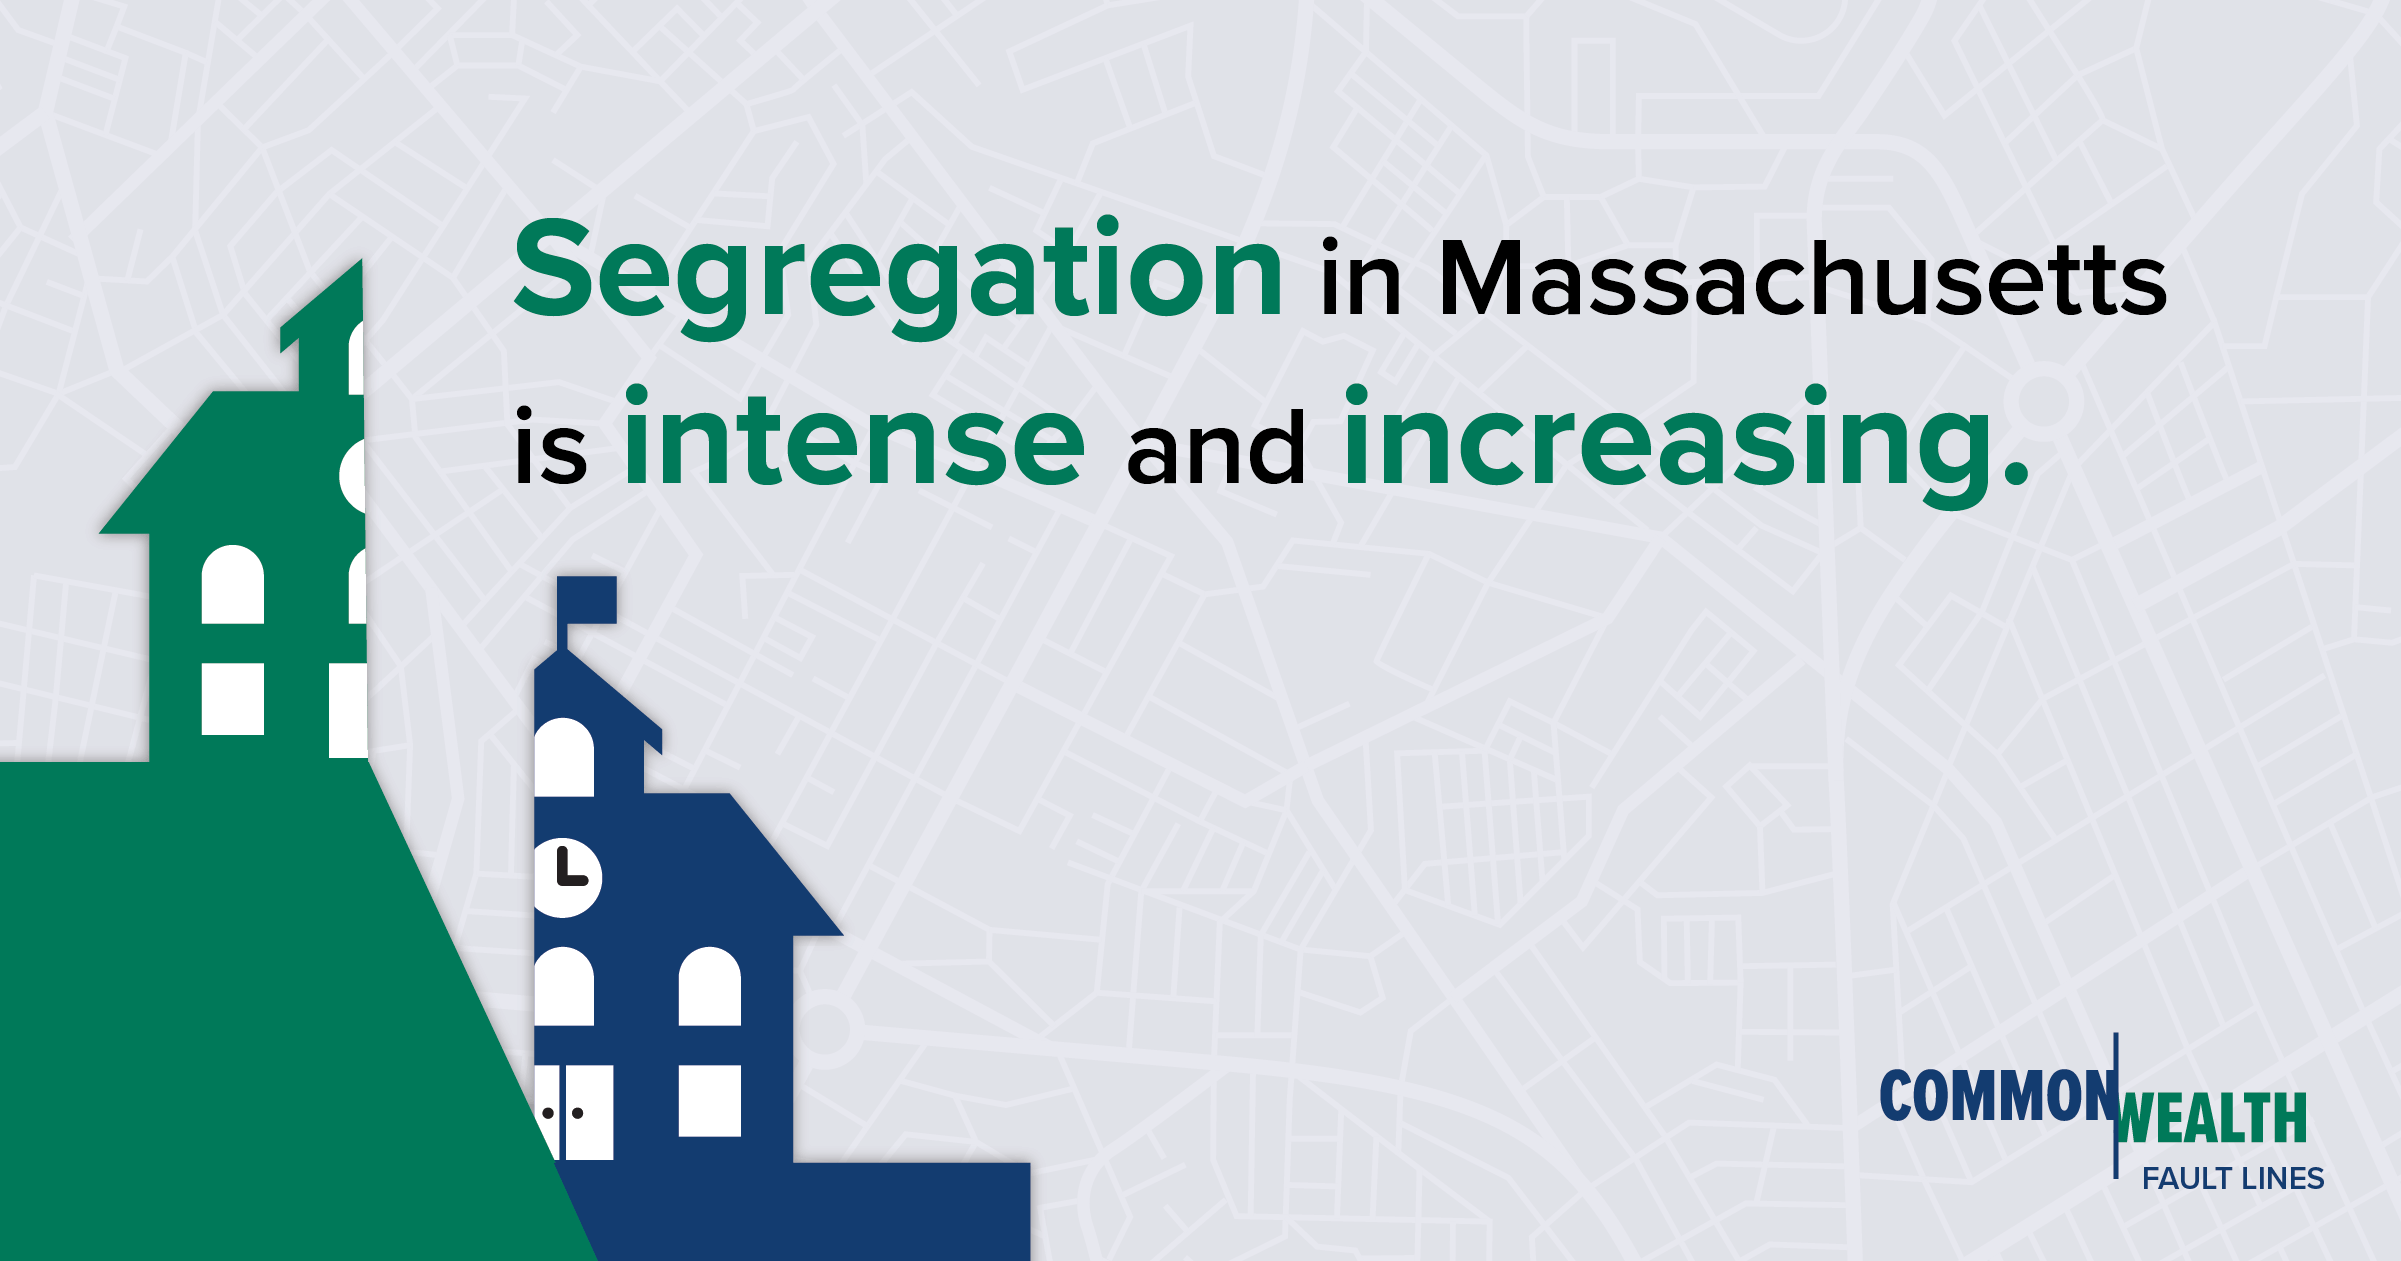
Images for social media